Full Report
The numbers behind Molina Healthcare, Inc.: as-reported financial statements and company metrics for FY2021–FY2025, traced to the source filings, opened with the share-price history those statements have to justify. Every linked figure opens the exact page of the filing it was printed on, with the statement row highlighted. Amounts in US$ millions unless noted.
Reading notes: Currency USD, figures in millions as printed on each filing's statements ('In millions, except per-share data'). Each fiscal year's income statement, balance sheet, cash-flow statement and premium-revenue-by-segment breakdown are cited to that year's own Form 10-K (each 10-K prints the current year in its first data column). Revenue breakdown uses the 10-K Item 1 'consolidated premium revenue by segment' table (premium revenue only). Its total ties exactly to the Consolidated Statements of Income 'Premium revenue' line each year. The Marketplace/Medicare/Other allocation in data/financials/segment.json differs for FY2021-FY2023 because that feed reports total segment revenue (including premium tax and other revenue), not premium-only; the filing's premium-only table was used. The 'Other' premium segment was first broken out as a separate line in the FY2024 10-K table (FY2024 shown as a dash / zero) and carried a $90M figure in FY2025; FY2021-FY2023 10-K tables have no 'Other' premium row.
Share Price — Full Available History — 23 Years
The stock closed at $224.82 on Jul 16, 2026 — up 2,429% over the window shown (+15.1% a year), trading between $7.44 and $419.53. At that close the stock trades at 25× FY2025 diluted EPS as reported below.
Source: market price feed, monthly closes, sampled from 5,796 source observations, Jul 2003–Jul 2026. Price return only, excludes dividends. Prices are split-adjusted (×1.5 on May 23, 2011).
Market capitalization $12.6bn and enterprise value $12.2bn.
Market cap = 56.2M shares outstanding × the Jul 16, 2026 close of $224.82. Enterprise value adds total debt of $3.8bn and subtracts cash and equivalents of $4.2bn (net cash of $482mn), from the FY2025 balance sheet. Market-derived figures, shown without filing links.
FY2025 at a Glance
Revenue (US$ millions)
Operating income (US$ millions)
Net income (US$ millions)
Diluted EPS
Source: FY2025 consolidated statements [1] [2] [3] [4]. Click any linked figure to open the filing page with the row highlighted.
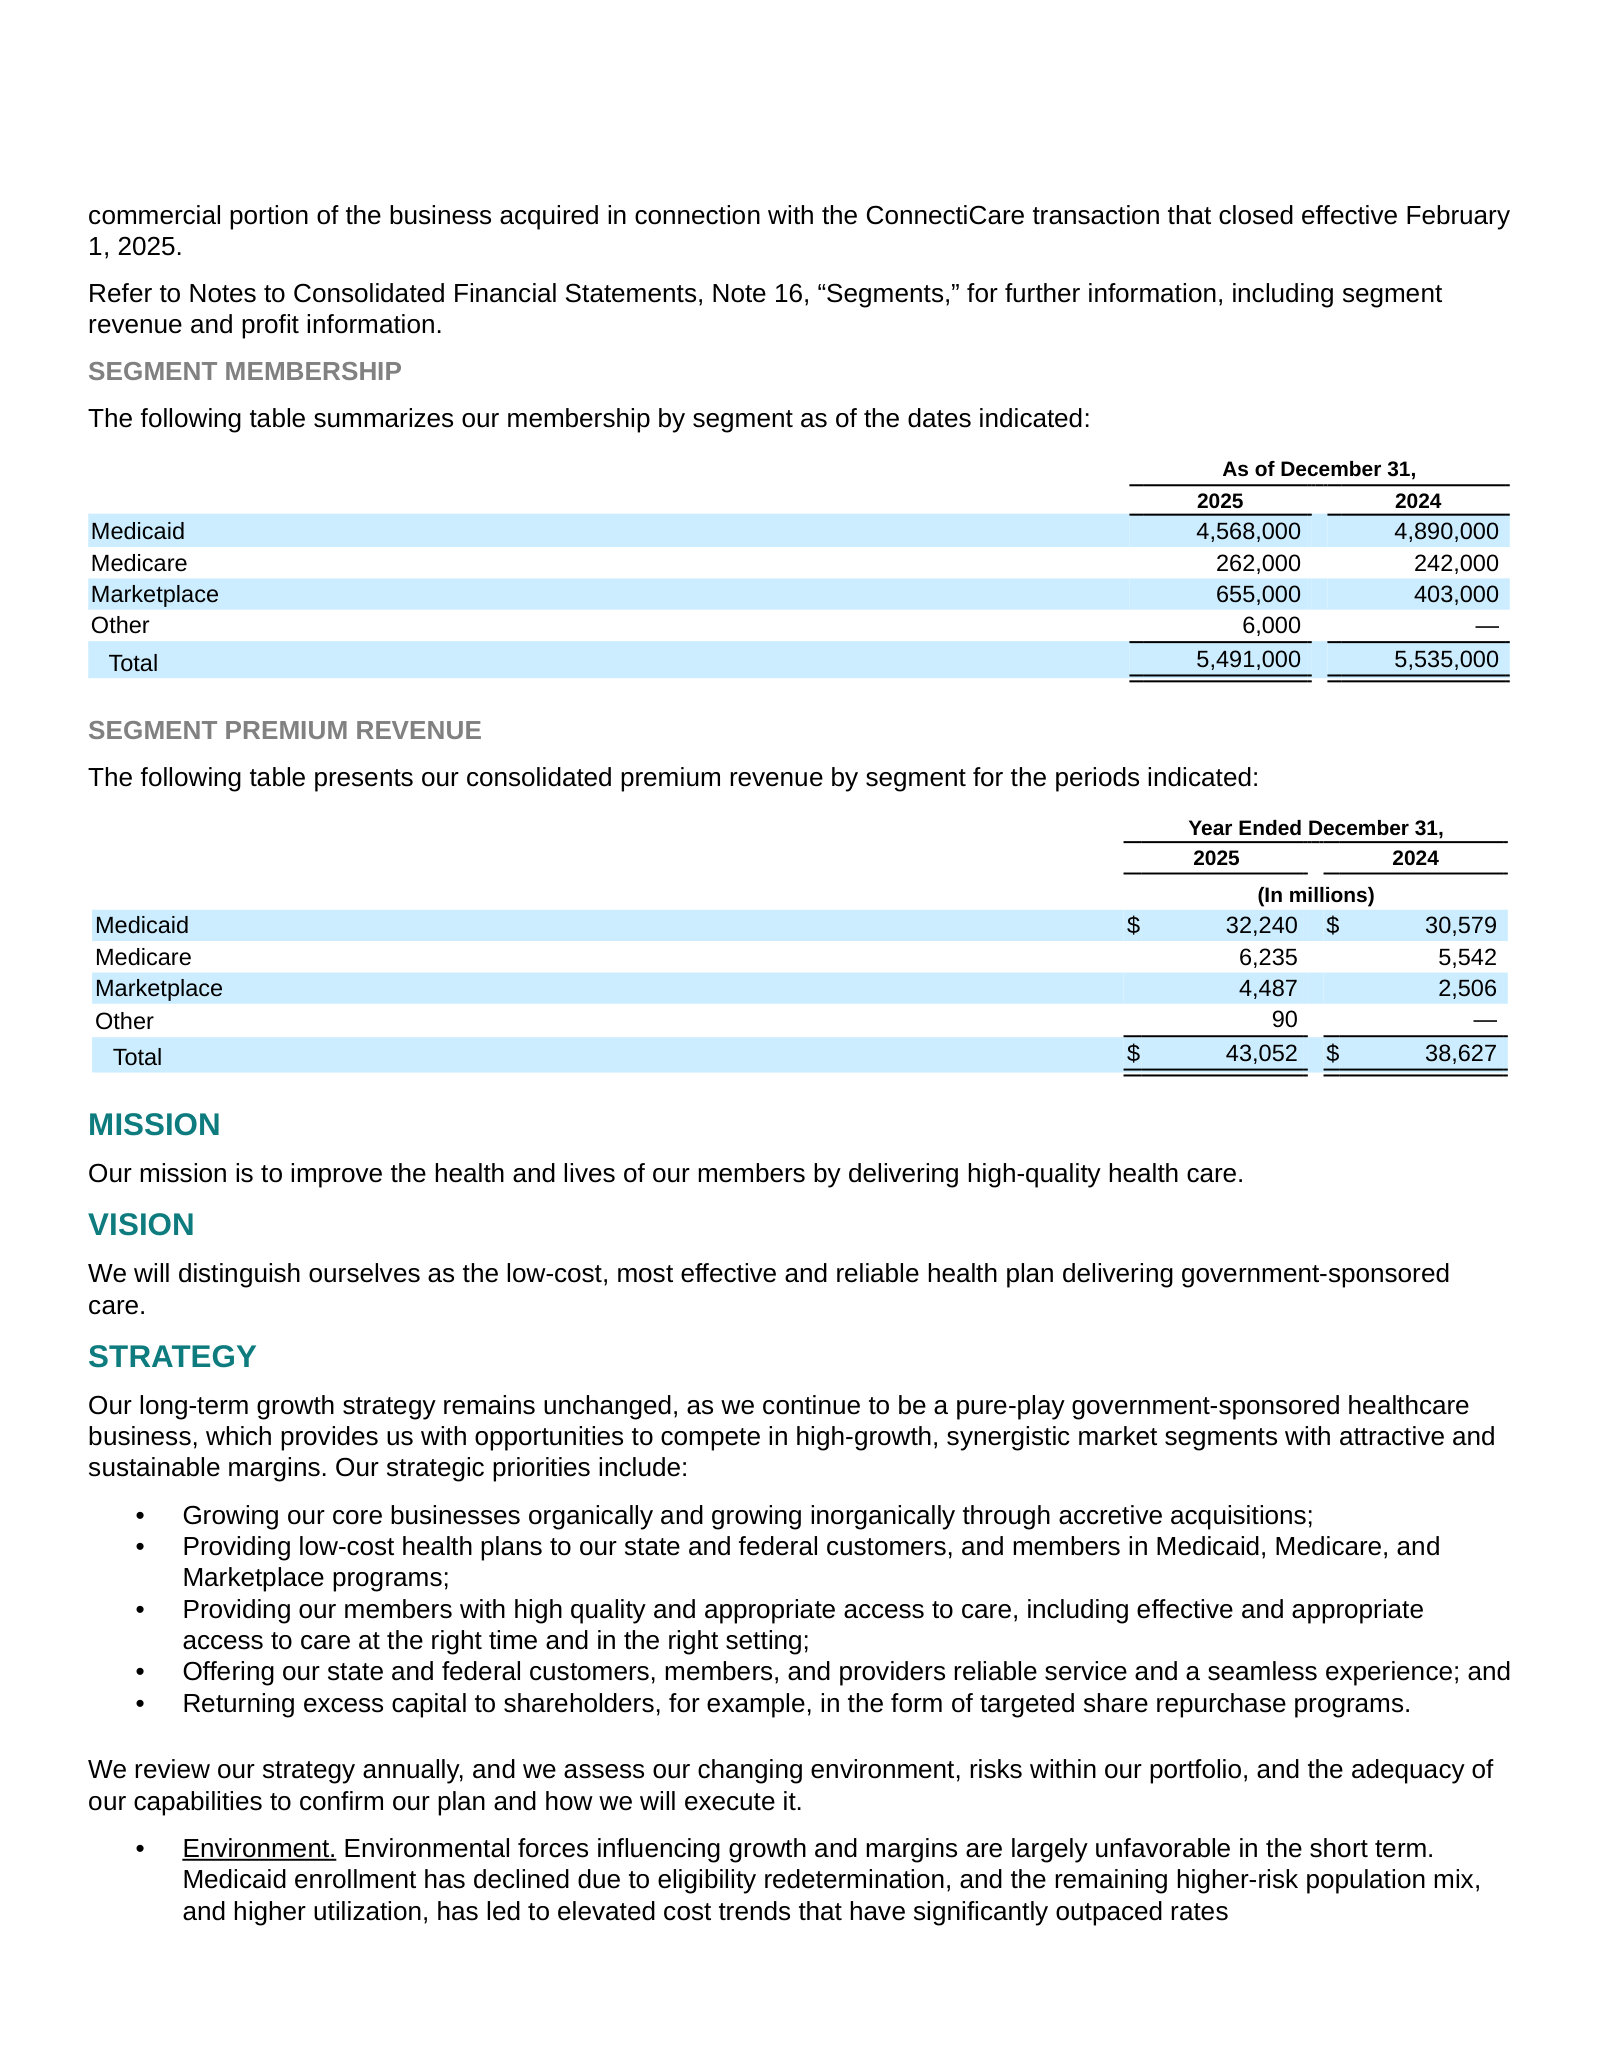
Premium Revenue by Segment
| Premium Revenue by Segment | FY2021 | FY2022 | FY2023 | FY2024 | FY2025 |
|---|---|---|---|---|---|
| Medicaid | 20,461 | 24,827 | 26,327 | 30,579 | 32,240 |
| Medicare | 3,361 | 3,795 | 4,179 | 5,542 | 6,235 |
| Marketplace | 3,033 | 2,261 | 2,023 | 2,506 | 4,487 |
| Other | — | — | — | — | 90 |
| Total premium revenue | 26,855 | 30,883 | 32,529 | 38,627 | 43,052 |
| Total premium revenue growth, derived | — | +15.0% | +5.3% | +18.7% | +11.5% |
Source: Form 10-K Item 1 Business, consolidated premium revenue by segment (premium revenue only; ties to the income-statement premium revenue line) [5] [6] [7] [8]. Click any linked figure to open the filing page with the row highlighted.
Income Statement
Source: Consolidated Statements of Income [1] [2] [3] [4]. Click any linked figure to open the filing page with the row highlighted.
Columns marked E are consensus analyst estimates from S&P Capital IQ (CapIQ), shown alongside reported results for direct comparison; they are not company guidance.
Estimate source: S&P Capital IQ (CapIQ) consensus, as of 2026-07-22. Estimate figures are S&P Capital IQ consensus (vendor data — no filing page links). EPS and net income use the normalized (adjusted) consensus where the street reports it. Line-item analyst models (segments, drivers, KPIs) are in the Visible Alpha tab.
Balance Sheet
Source: Consolidated Balance Sheets [9] [10] [11] [12]. Click any linked figure to open the filing page with the row highlighted.
Cash Flow
Source: Consolidated Statements of Cash Flows [13] [14] [15] [16]. Click any linked figure to open the filing page with the row highlighted.
Medical Care Ratio by Segment
| Medical Care Ratio by Segment | FY2021 | FY2022 | FY2023 | FY2024 | FY2025 |
|---|---|---|---|---|---|
| Medicaid MCR | 88.7% | 88.0% | 88.7% | 90.3% | 91.8% |
| Medicare MCR | 87.2% | 88.5% | 90.7% | 89.1% | 92.4% |
| Marketplace MCR | 86.9% | 87.2% | 75.3% | 75.4% | 90.6% |
Source: company filings [17] [18] [19] [20]. Click any linked figure to open the filing page with the row highlighted.
Medical Margin by Segment
| Medical Margin by Segment | FY2021 | FY2022 | FY2023 | FY2024 | FY2025 |
|---|---|---|---|---|---|
| Medicaid | 2,322 | 2,981 | 2,973 | 2,979 | 2,652 |
| Medicare | 430 | 437 | 388 | 603 | 475 |
| Marketplace | 399 | 290 | 499 | 617 | 423 |
| Total medical margin | 3,151 | 3,708 | 3,860 | 4,199 | 3,564 |
Source: company filings [17] [18] [19] [20]. Click any linked figure to open the filing page with the row highlighted.
Operating and Tax Ratios
| Operating and Tax Ratios | FY2021 | FY2022 | FY2023 | FY2024 | FY2025 |
|---|---|---|---|---|---|
| G A expense ratio | 7.4% | 7.2% | 7.2% | 6.7% | 6.6% |
| Premium tax ratio | 2.8% | 2.7% | 3.2% | 3.7% | 4.1% |
| Effective income tax rate | 24.7% | 25.5% | 25.5% | 25.8% | 19.8% |
Source: company filings [21] [22] [23] [24]. Click any linked figure to open the filing page with the row highlighted.
Non-Premium Revenue and Medicare Enrollment
| Non-Premium Revenue and Medicare Enrollment | FY2021 | FY2022 | FY2023 | FY2024 | FY2025 |
|---|---|---|---|---|---|
| Premium tax revenue | 787 | 873 | 1,069 | 1,486 | 1,863 |
| Investment income | 52 | 143 | 394 | 452 | 420 |
| Other revenue | 77 | 75 | 80 | 85 | 91 |
| Medicare membership | 142,000 | 156,000 | 172,000 | 242,000 | 262,000 |
Source: company filings [1] [5] [2] [6]. Click any linked figure to open the filing page with the row highlighted.
Long-Term Record
| Fiscal year | Total revenue | Operating income | Net income | Diluted net income per share | Net cash provided by (used in) operating activities |
|---|---|---|---|---|---|
| FY2016 | 17,782 | 306 | 52 | 0.92 | — |
| FY2017 | 19,883 | (555) | (512) | (9.07) | — |
| FY2018 | 18,890 | 1,131 | 707 | 10.61 | — |
| FY2019 | 16,829 | 1,044 | 737 | 11.47 | — |
| FY2020 | 19,423 | 1,078 | 673 | 11.23 | 1,898 |
| FY2021 | 27,771 | 1,020 | 659 | 11.25 | 2,119 |
| FY2022 | 31,974 | 1,173 | 792 | 13.55 | 773 |
| FY2023 | 34,072 | 1,573 | 1,091 | 18.77 | 1,662 |
| FY2024 | 40,650 | 1,707 | 1,179 | 20.42 | 644 |
| FY2025 | 45,426 | 781 | 472 | 8.92 | (535) |
Source: consolidated statements across filings; older years from the standardized feed [13] [1] [14] [2]. Click any linked figure to open the filing page with the row highlighted.
Operating KPIs
| KPI | FY2021 | FY2022 | FY2023 | FY2024 | FY2025 |
|---|---|---|---|---|---|
| Total membership | 5,199,000 | 5,258,000 | 4,995,000 | 5,535,000 | 5,491,000 |
| Medicaid membership | 4,329,000 | 4,754,000 | 4,542,000 | 4,890,000 | 4,568,000 |
| Marketplace membership | 728,000 | 348,000 | 281,000 | 403,000 | 655,000 |
| Consolidated medical care ratio (MCR) | 88.3% | 88.0% | 88.1% | 89.1% | 91.7% |
Source: company-reported operating metrics [5] [25] [6] [26]. Click any linked figure to open the filing page with the row highlighted.
Analyst Consensus
Mean target
Median target
High target
Low target
Street ratings: 3 strong buy, 15 hold, 1 sell. Consensus: Hold.
Estimate source: S&P Capital IQ (CapIQ) consensus, as of 2026-07-22. Estimate figures are S&P Capital IQ consensus (vendor data — no filing page links). EPS and net income use the normalized (adjusted) consensus where the street reports it. Line-item analyst models (segments, drivers, KPIs) are in the Visible Alpha tab.
Traceability
349 of 371 figures on this page (94%) link to the filing page where they are printed — click a linked figure to open the source PDF at that page with the row highlighted. Unlinked figures come from standardized data feeds or pre-filing years.
Currency USD, figures in millions as printed on each filing's statements ('In millions, except per-share data').
Each fiscal year's income statement, balance sheet, cash-flow statement and premium-revenue-by-segment breakdown are cited to that year's own Form 10-K (each 10-K prints the current year in its first data column).
Revenue breakdown uses the 10-K Item 1 'consolidated premium revenue by segment' table (premium revenue only). Its total ties exactly to the Consolidated Statements of Income 'Premium revenue' line each year. The Marketplace/Medicare/Other allocation in data/financials/segment.json differs for FY2021-FY2023 because that feed reports total segment revenue (including premium tax and other revenue), not premium-only; the filing's premium-only table was used.
The 'Other' premium segment was first broken out as a separate line in the FY2024 10-K table (FY2024 shown as a dash / zero) and carried a $90M figure in FY2025; FY2021-FY2023 10-K tables have no 'Other' premium row.
FY2016-FY2020 long-term-record figures come from the standardized data feed (SEC XBRL via fiscal.ai) and are shown without page links; FY2021-FY2025 long-term rows are filing-cited. FY2016-FY2019 operating cash flow is not carried in the feed and is left blank.
Balance sheet 'Goodwill and intangible assets, net' is the filing's single combined line; the data feed's goodwill-only figure (e.g. $1,671M FY2024) is a component of it and is not a discrepancy.
Quarterly block covers Q1 FY25 through Q1 FY26 (fiscal quarters ending 2025-03-31 to 2026-03-31). Income and balance-sheet figures are printed in the 10-Qs; Q4 FY25 income is derived from the FY2025 10-K less the nine-month YTD, and single-quarter operating cash flows are derived from the printed YTD cash-flow statements. All derived operating-cash-flow quarters reconcile exactly and match data/financials/cash_flow_quarterly.json (190, -302, -125, -298, 1,082).
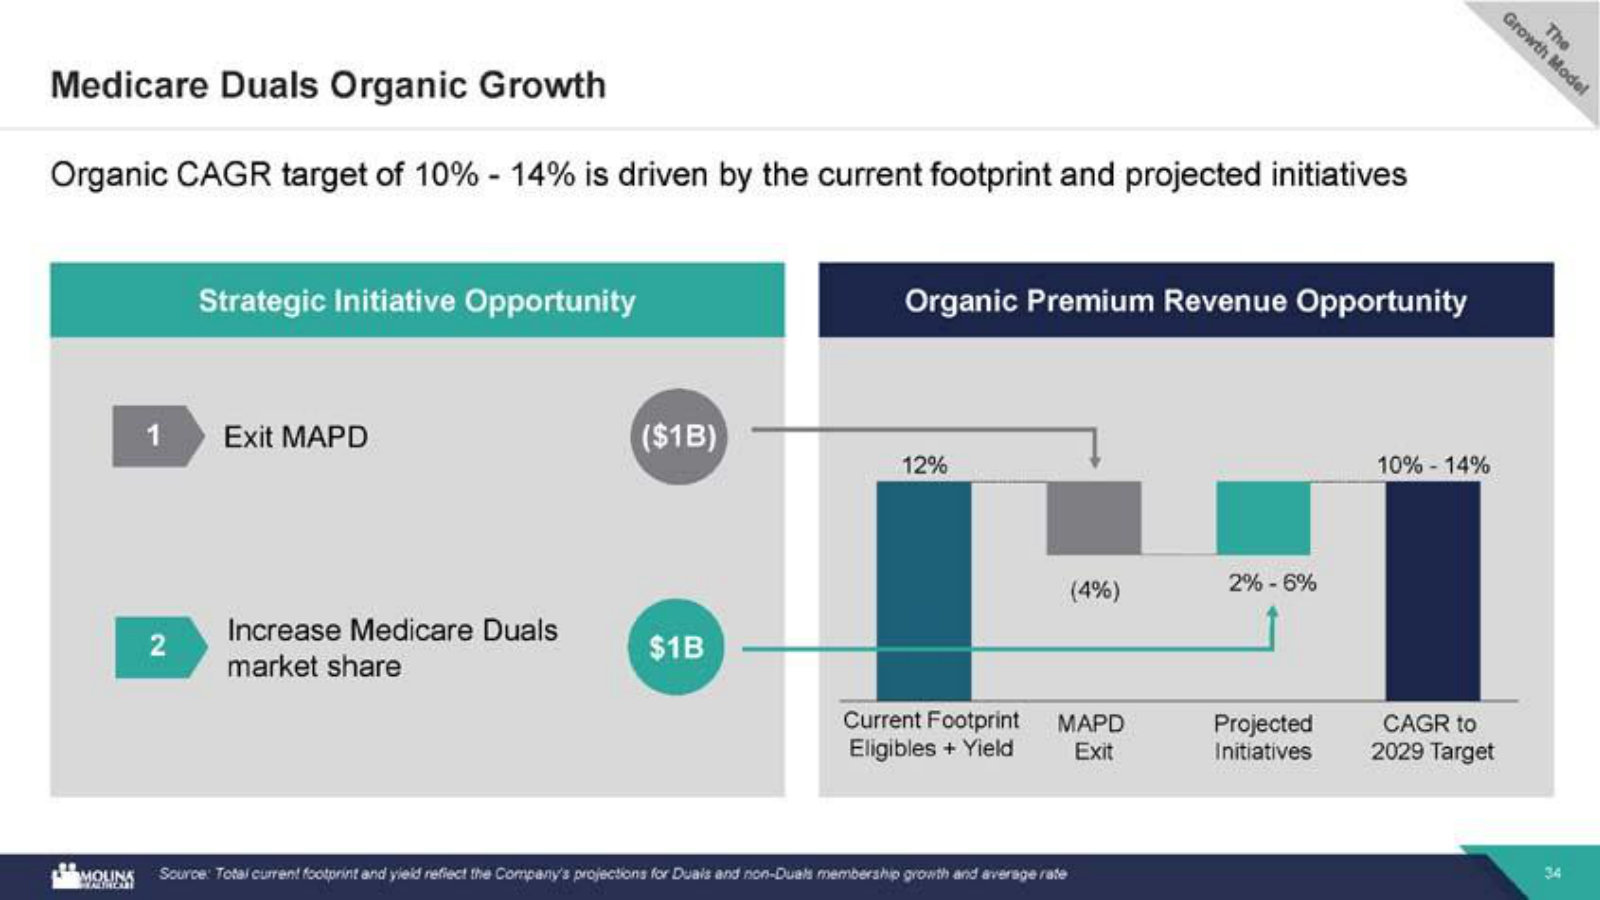
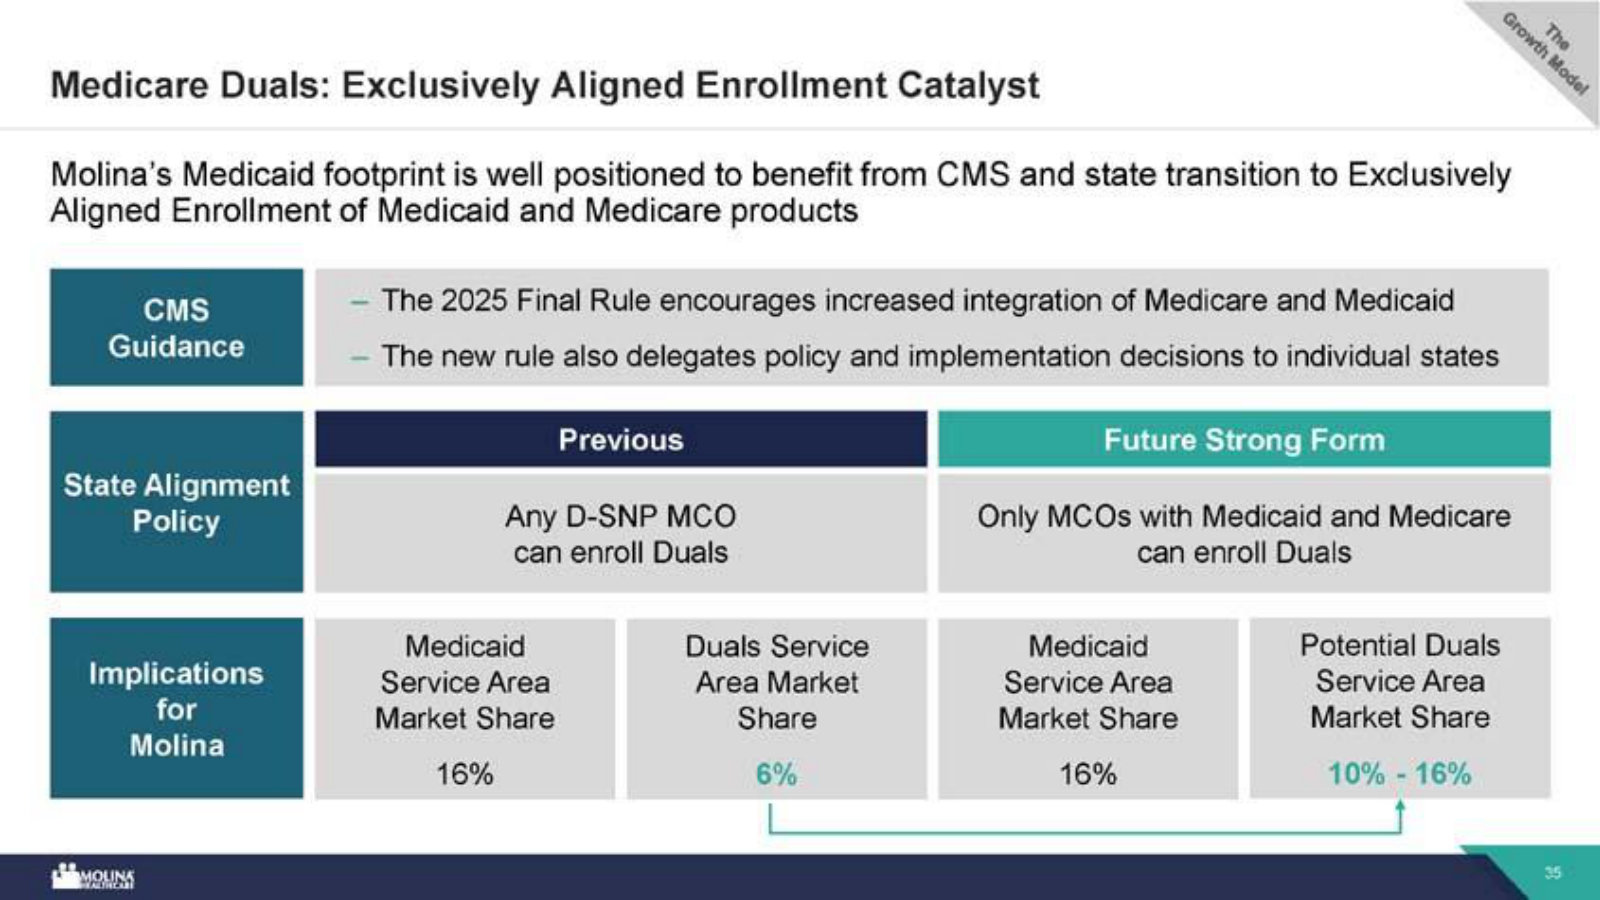
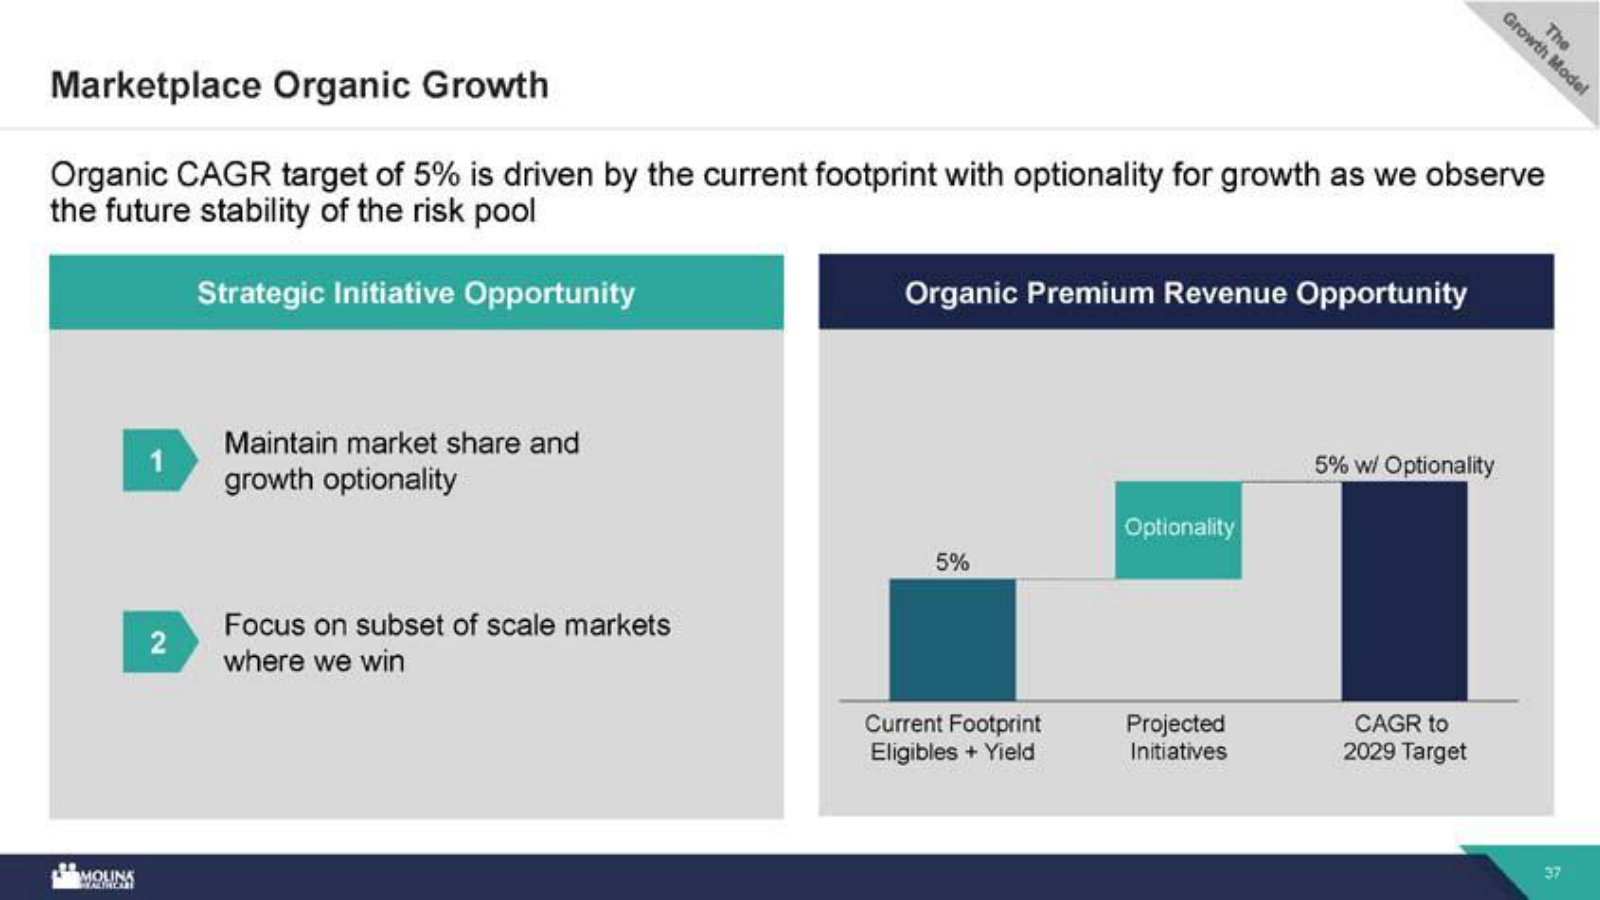
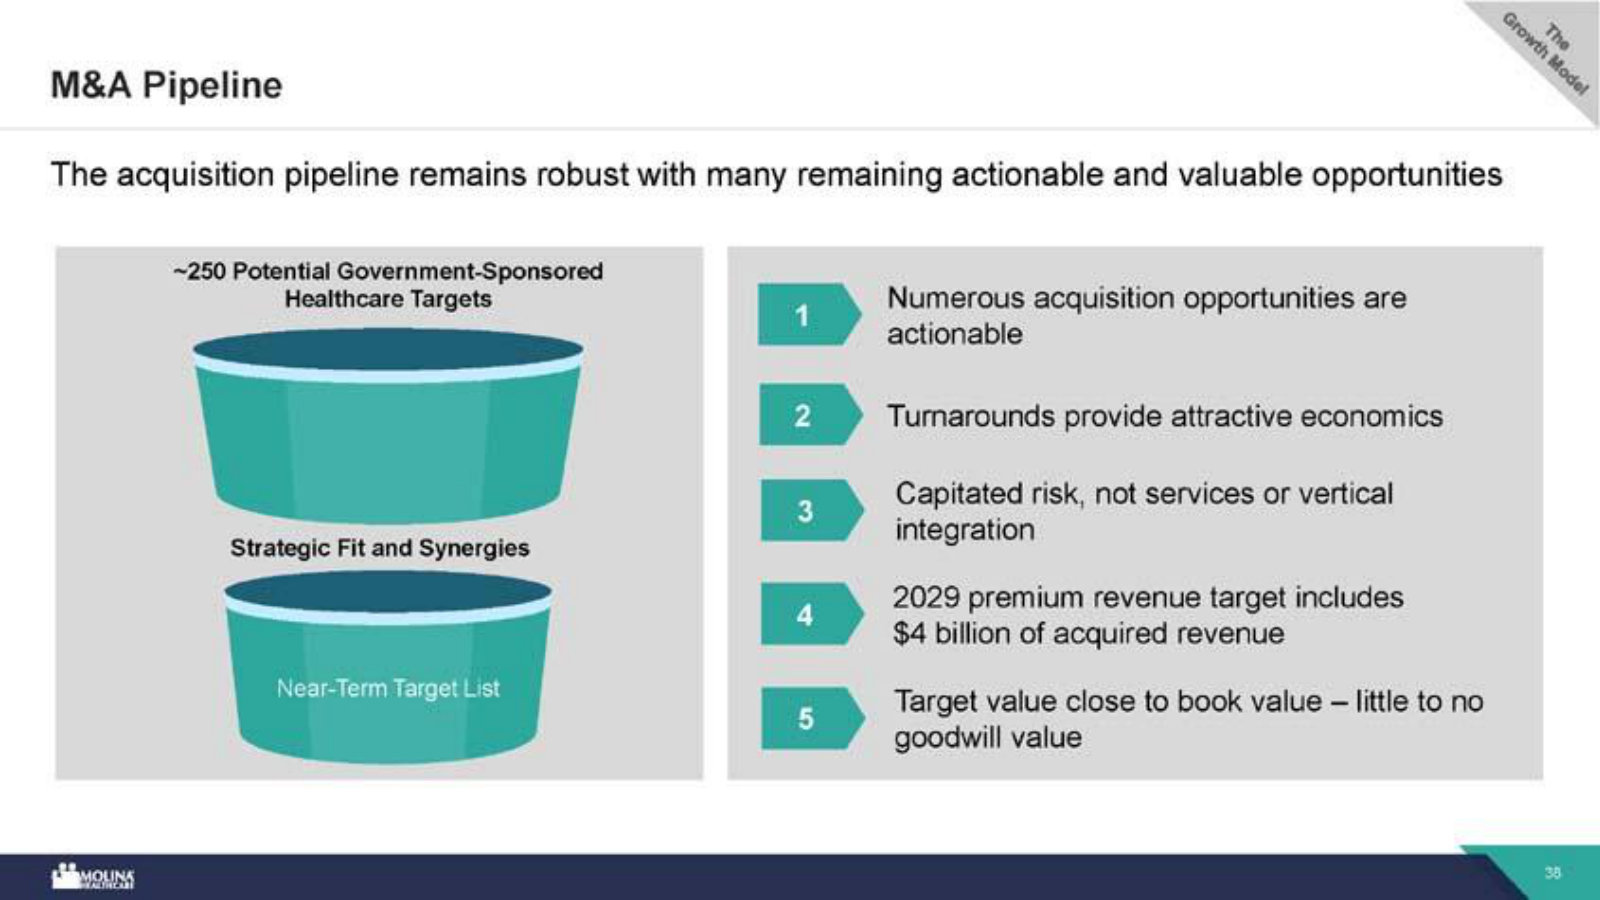
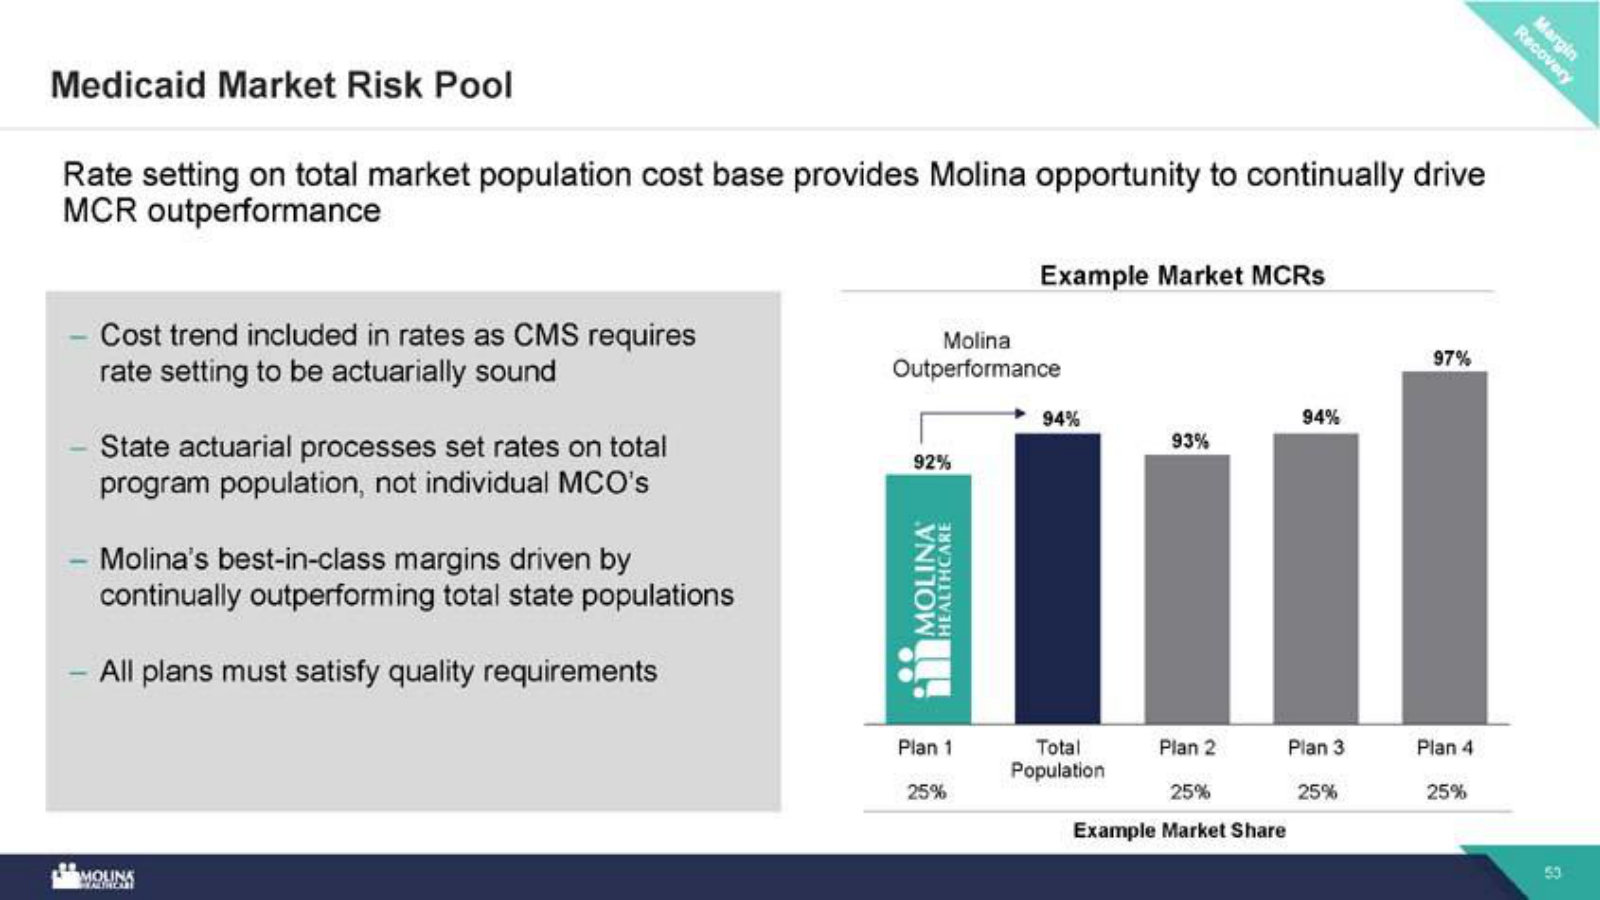
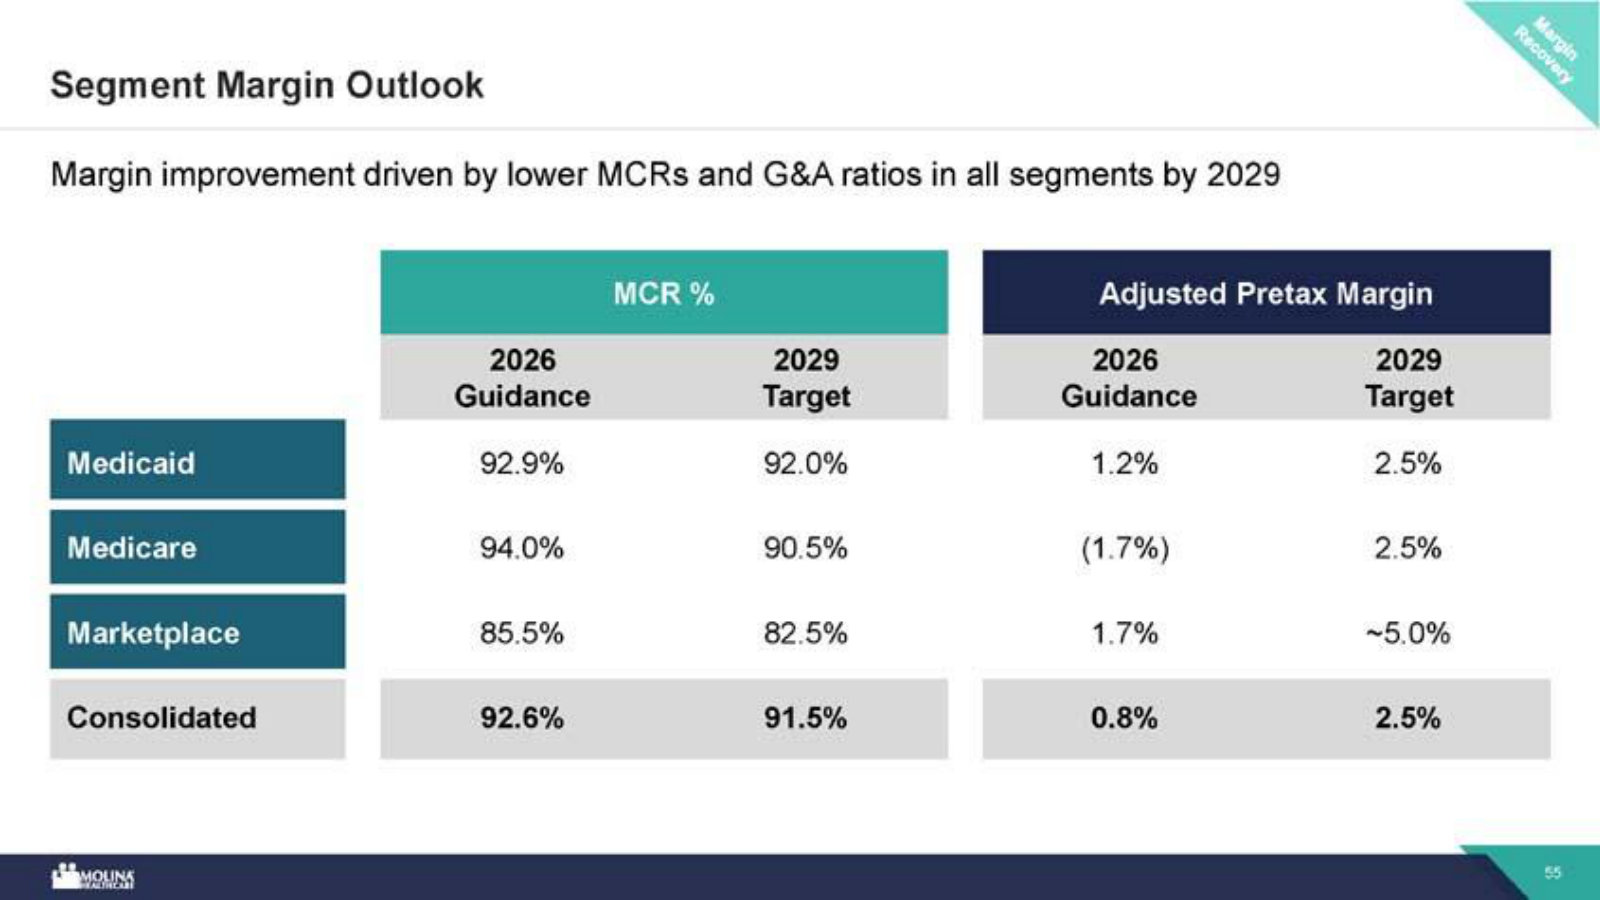
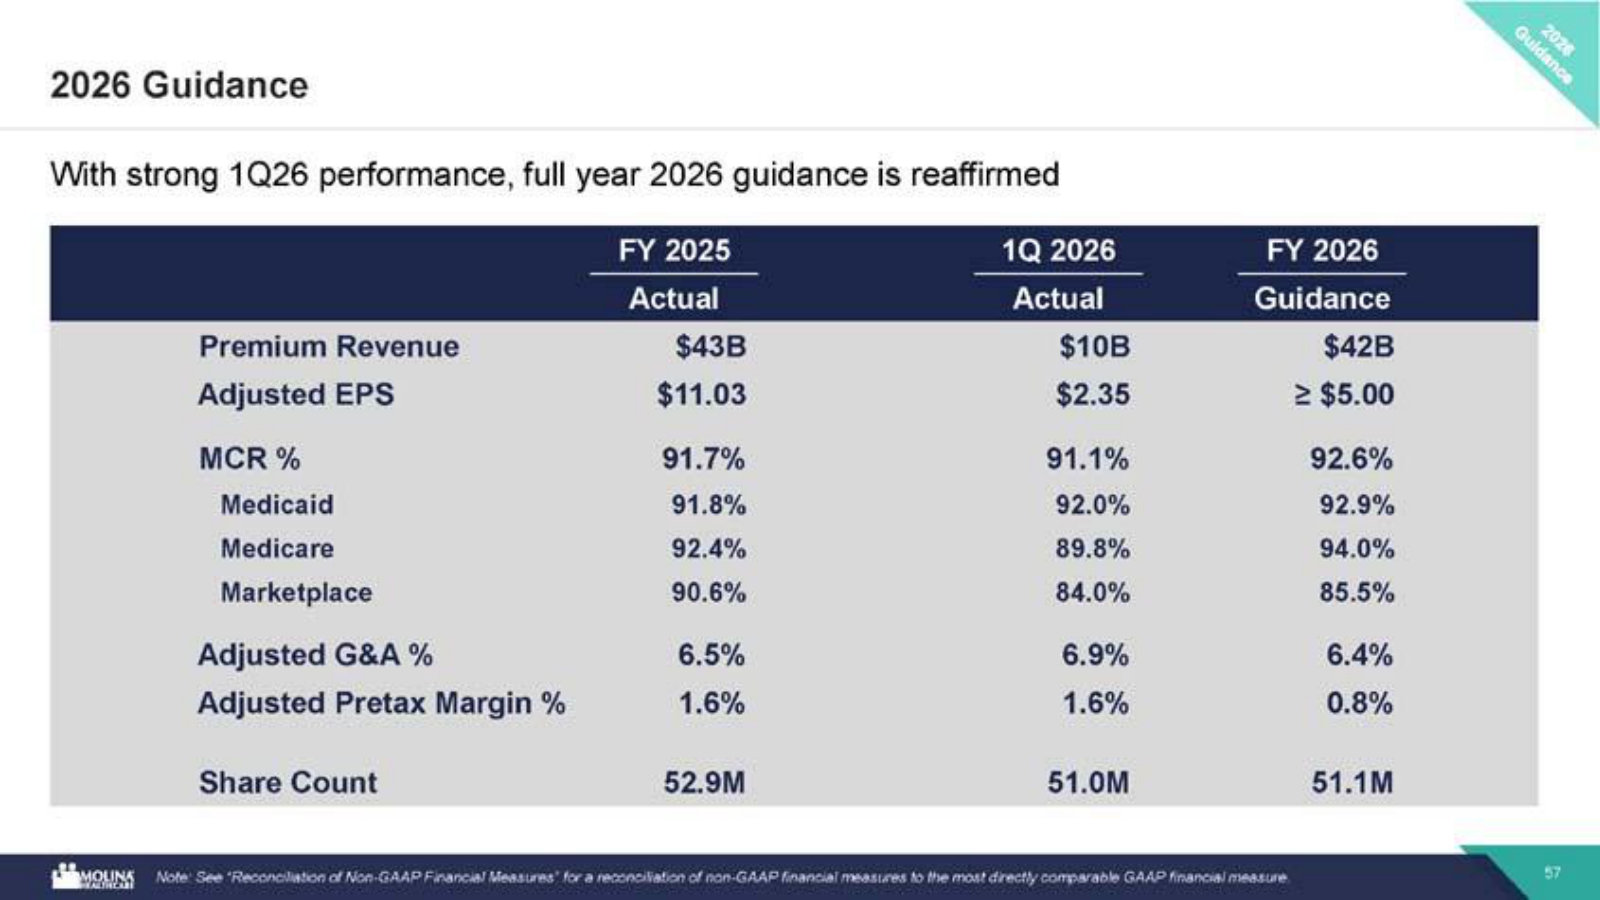
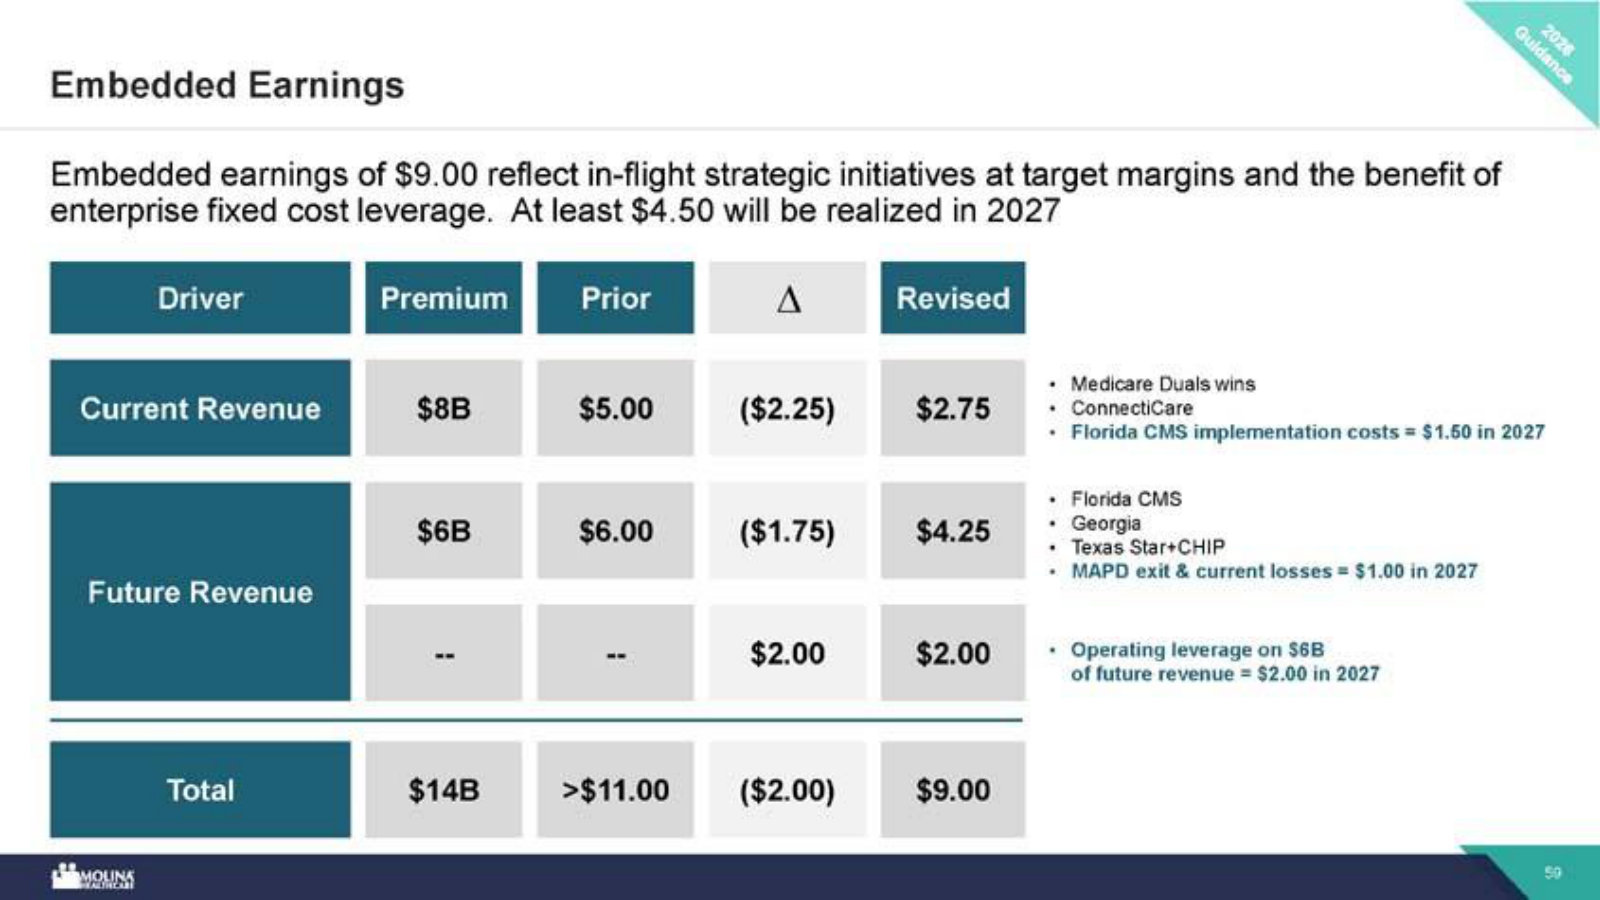
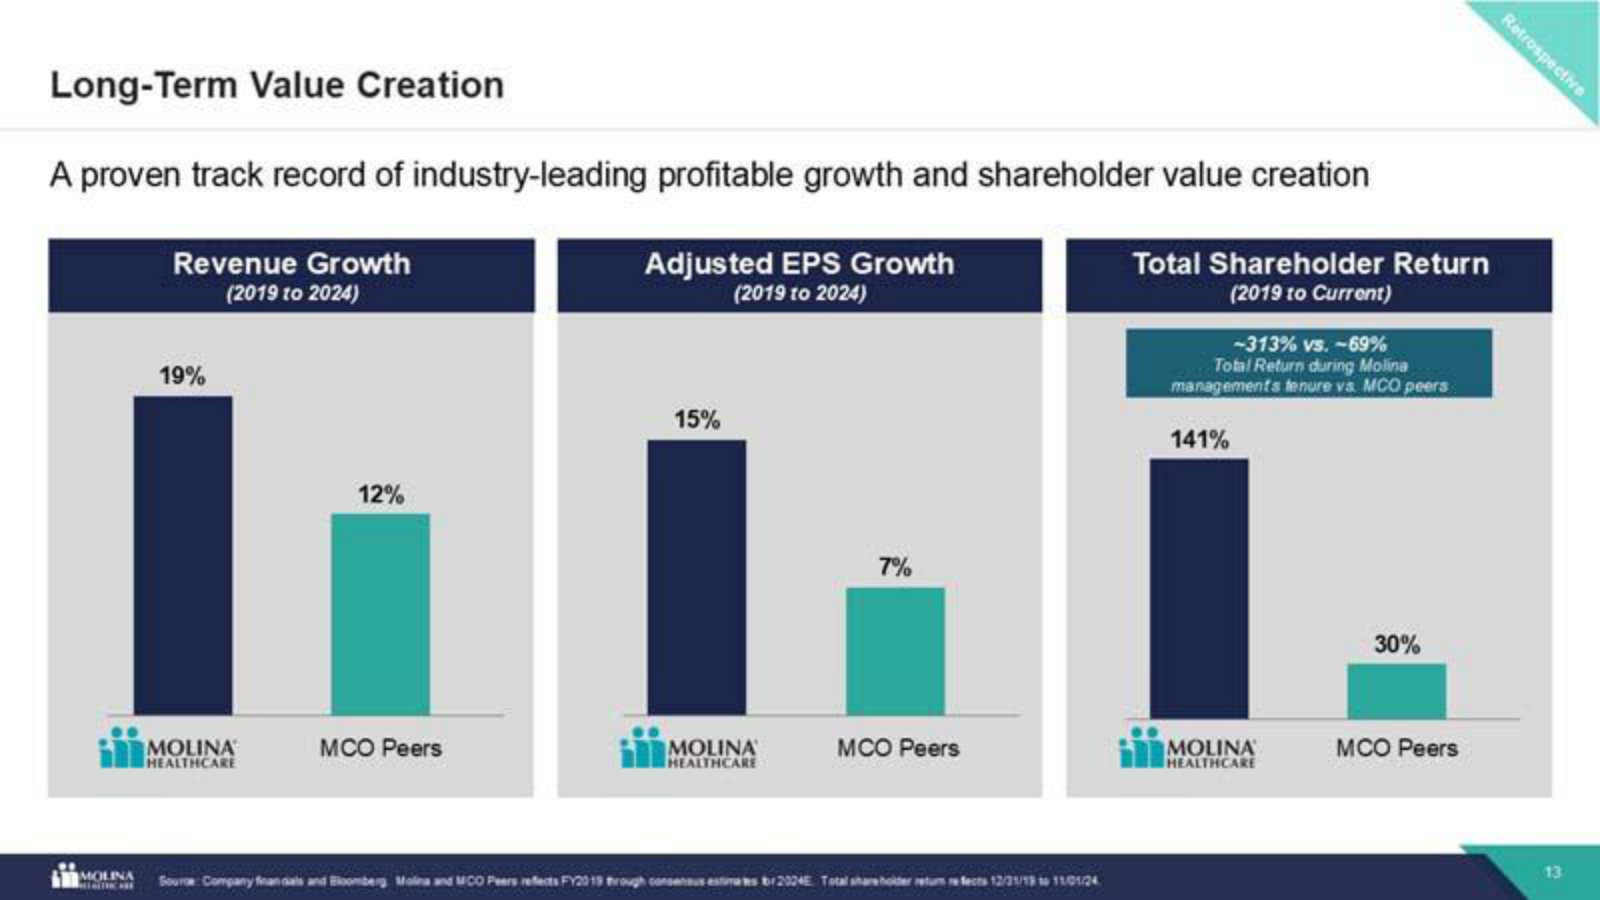
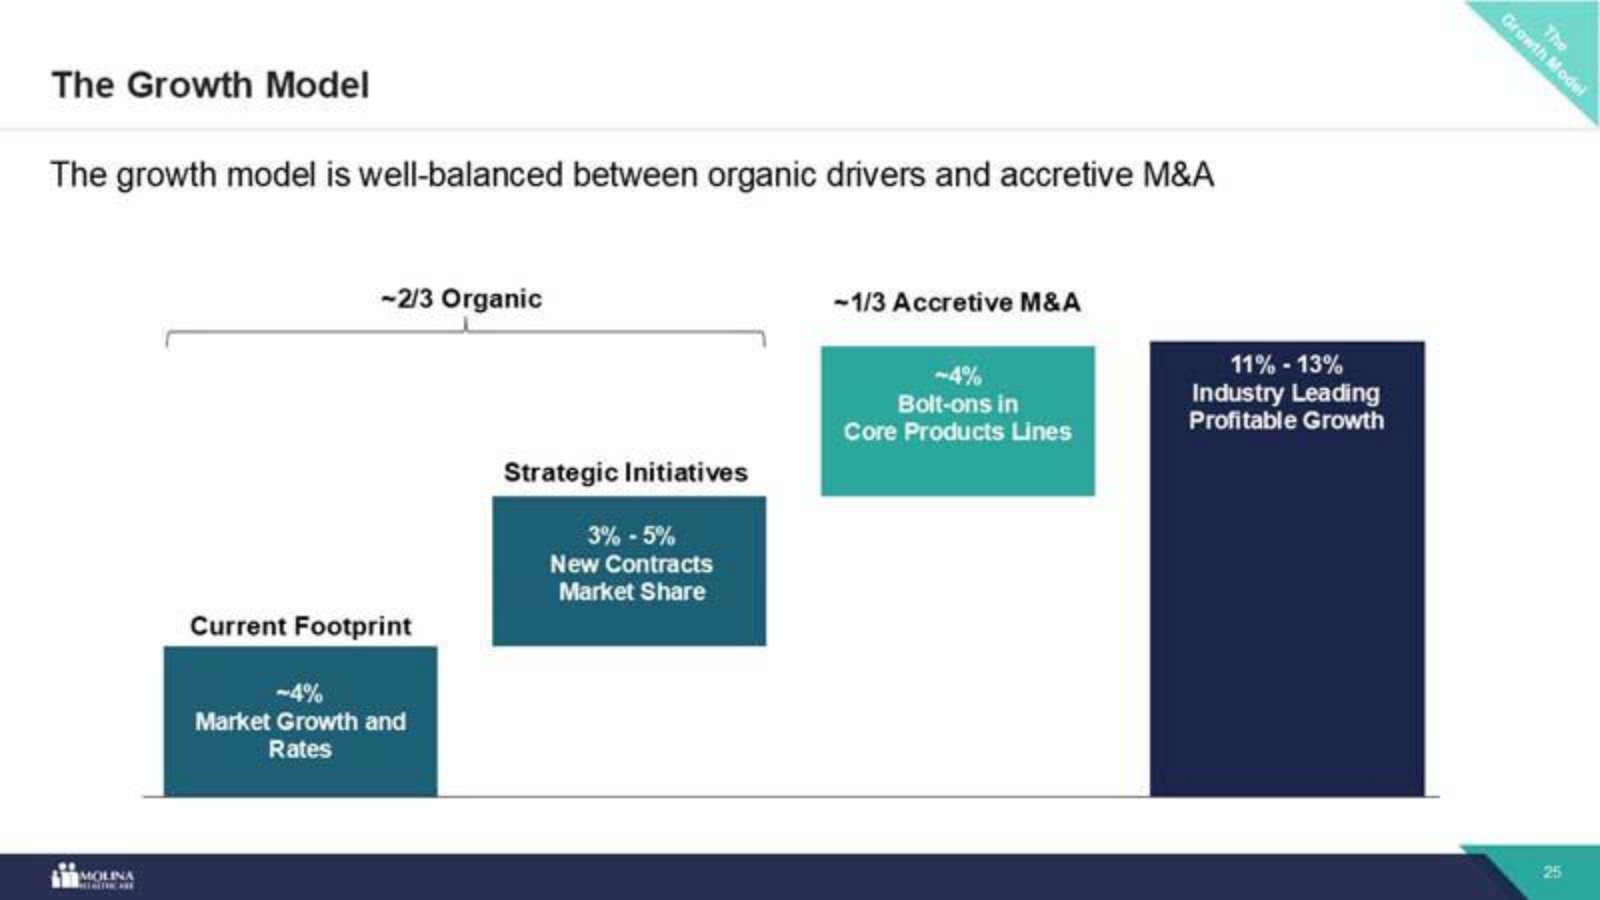
Molina Healthcare, Inc.'s management explains the business in its own materials. The slides below do the most of that work, pulled from the documents preserved in Sources. Each source link opens the complete presentation at that slide in a new tab.
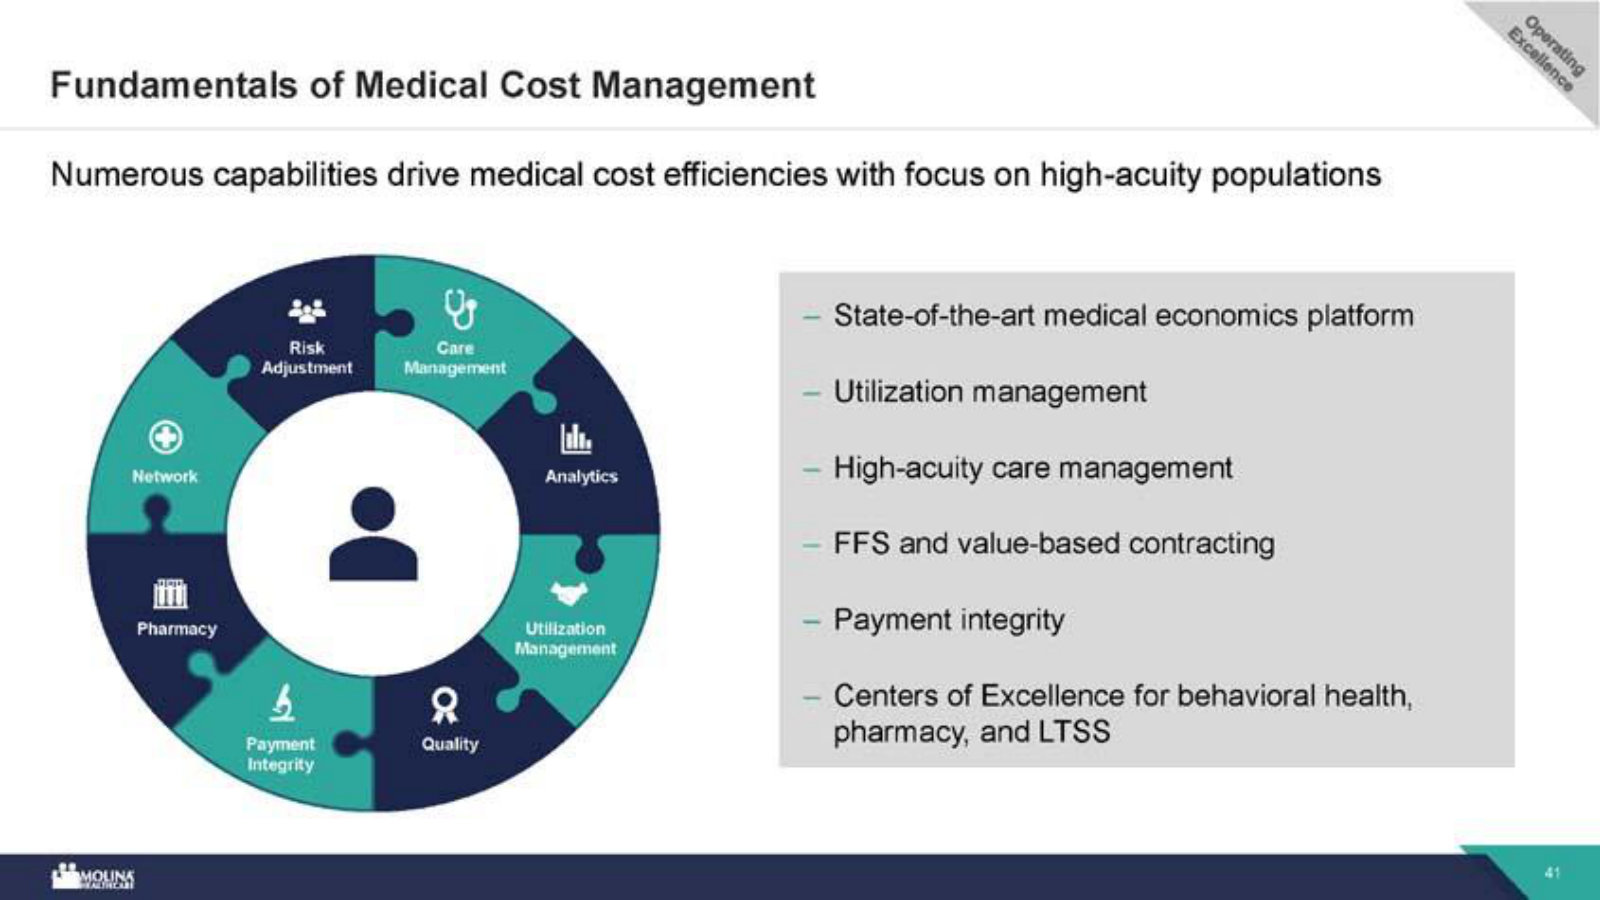
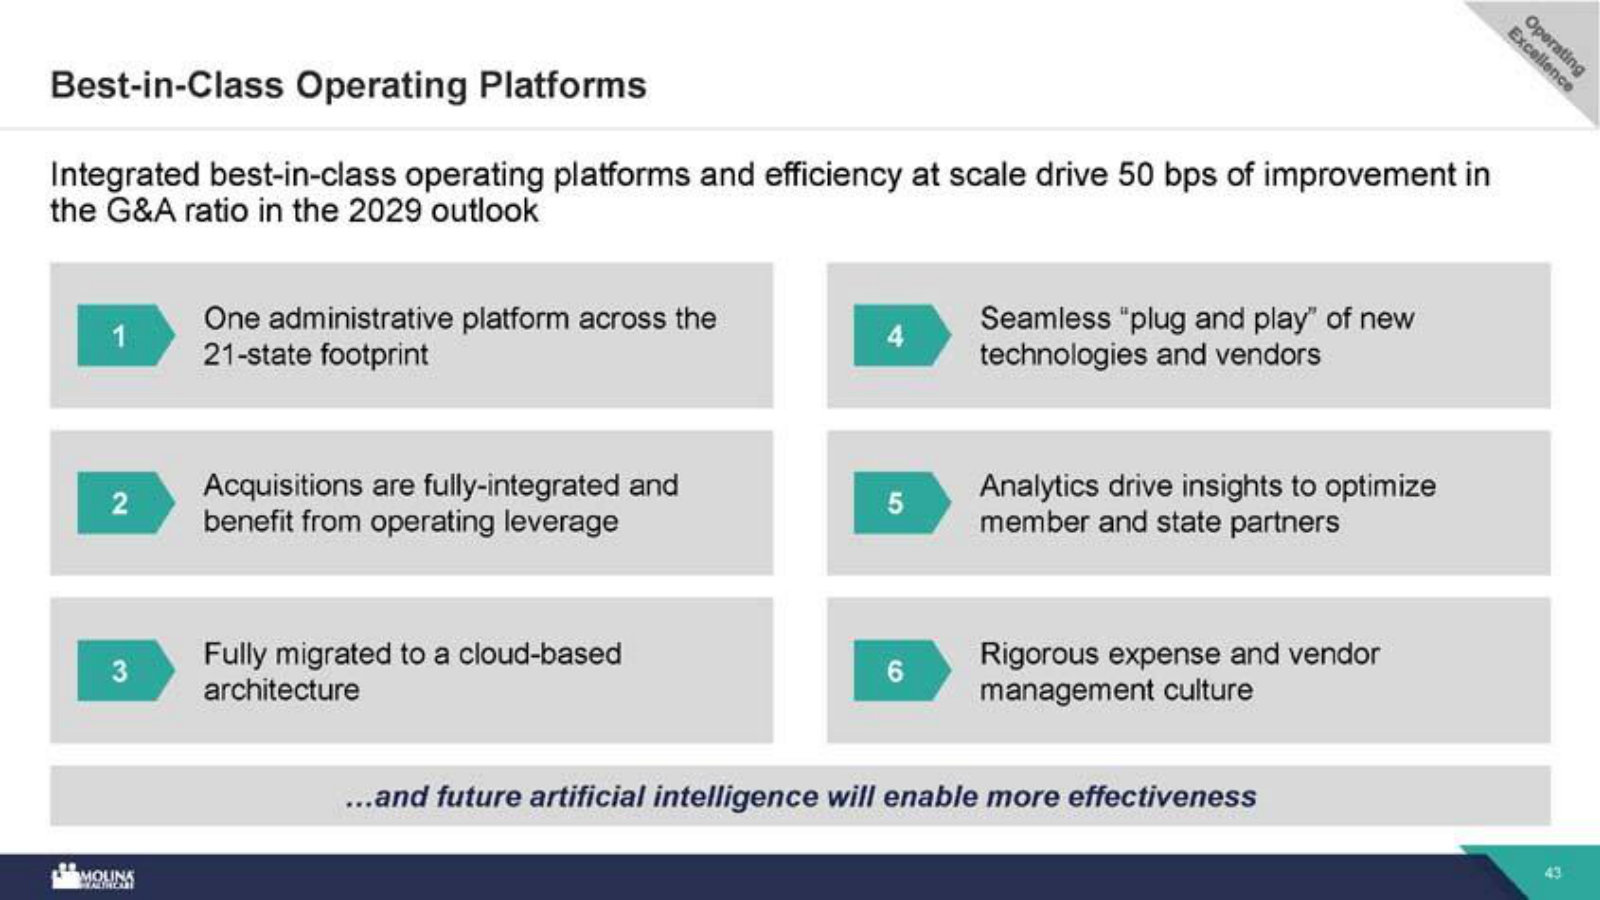
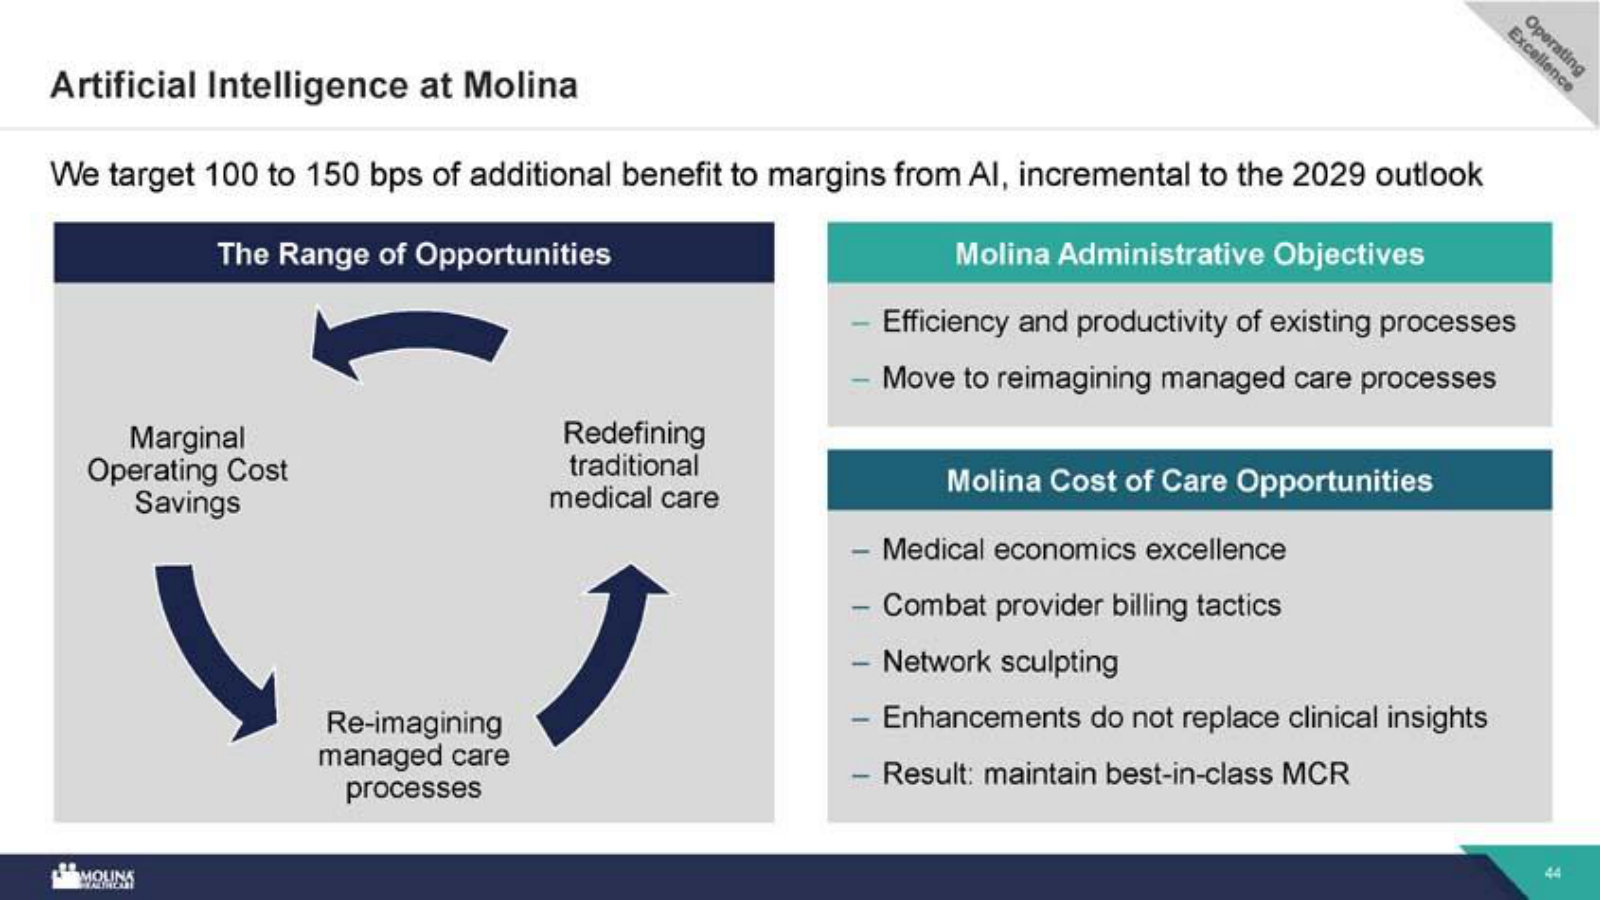
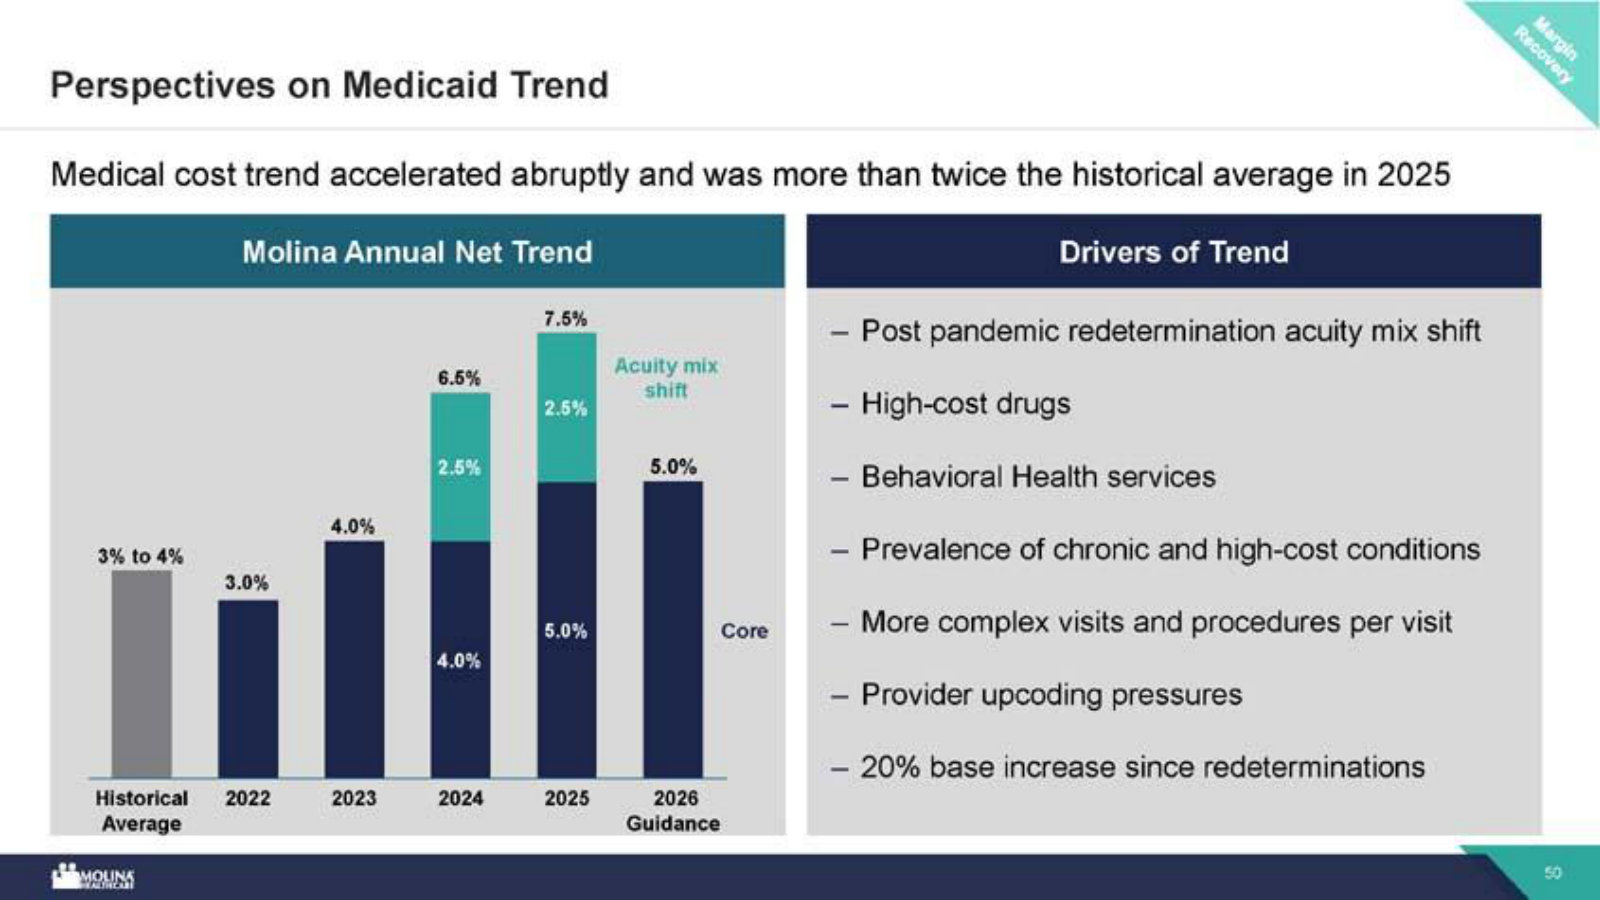
Investor Day 2026 — Realizing The Intrinsic Value…Again — 2026
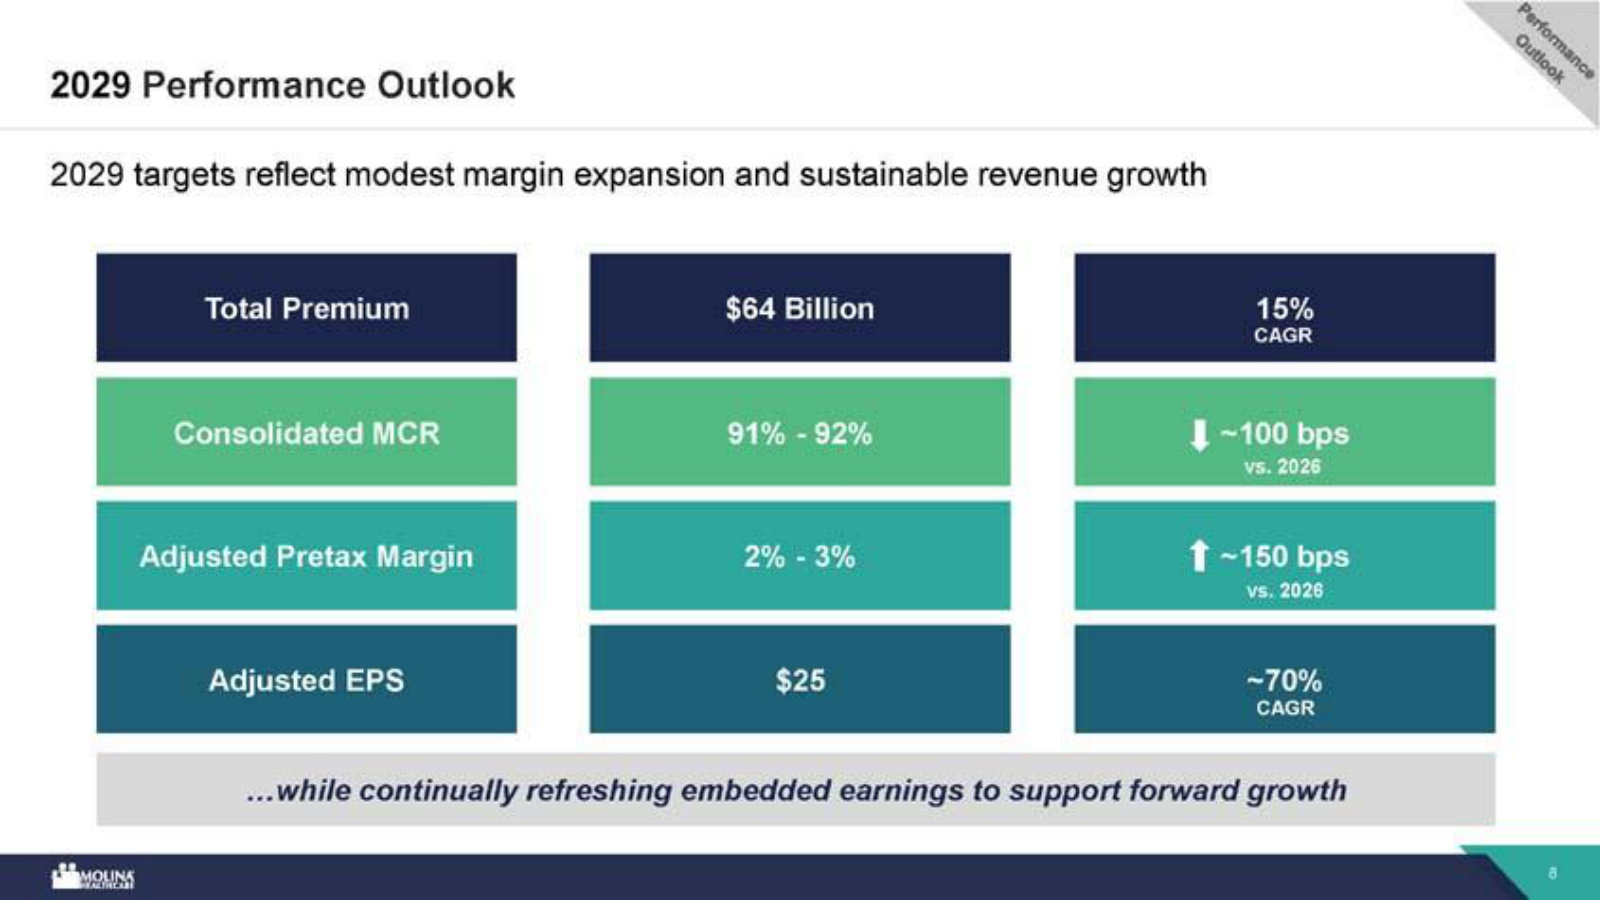
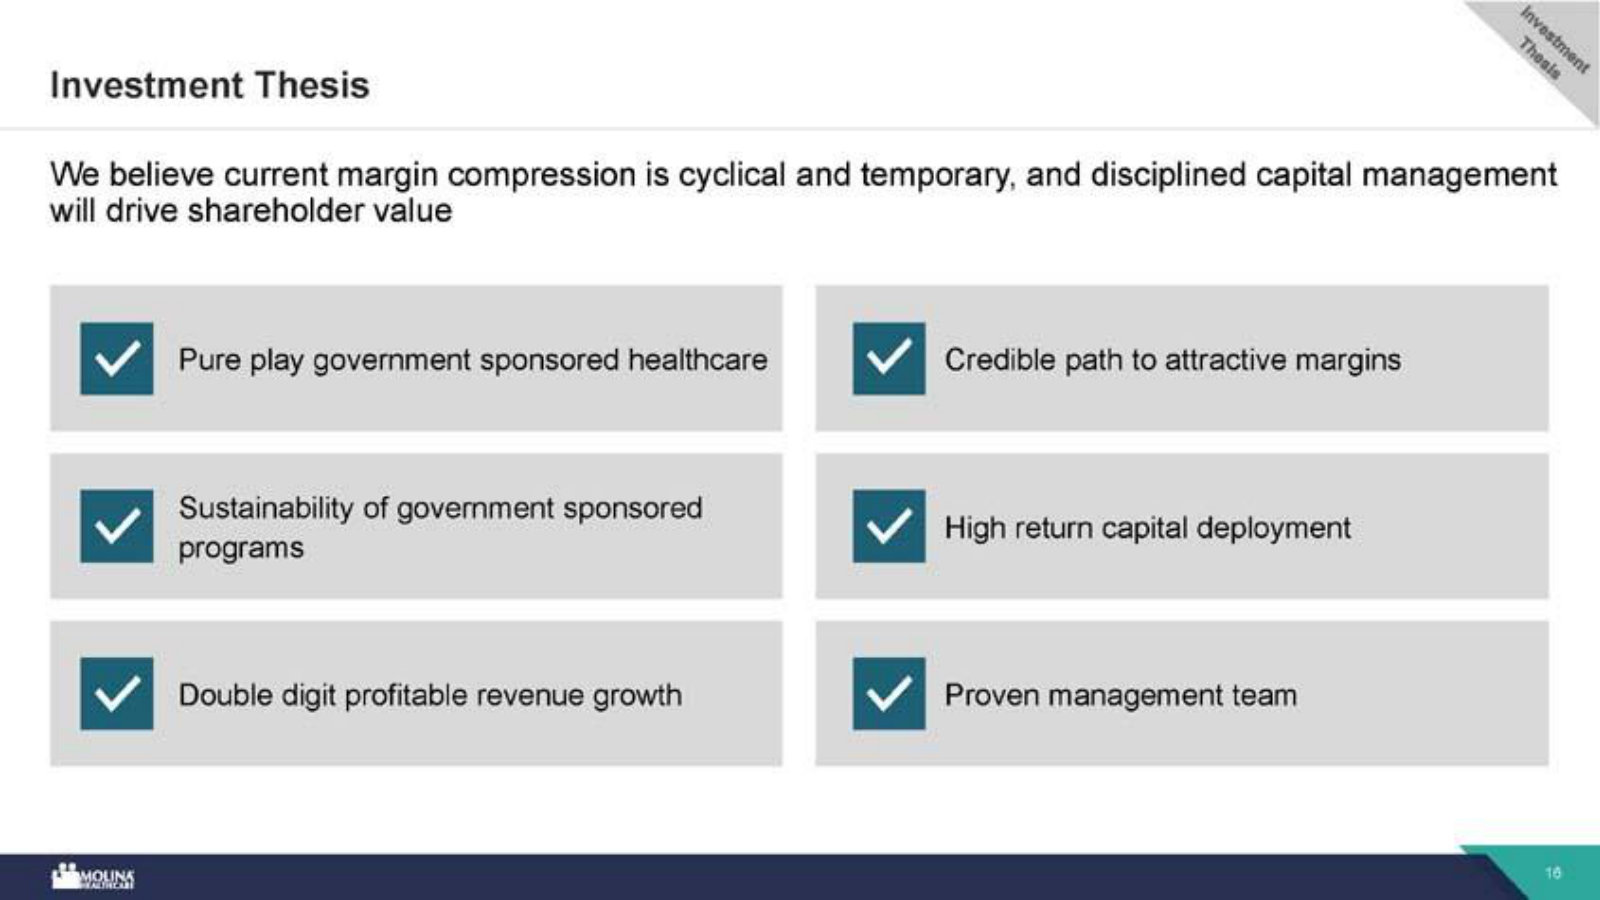
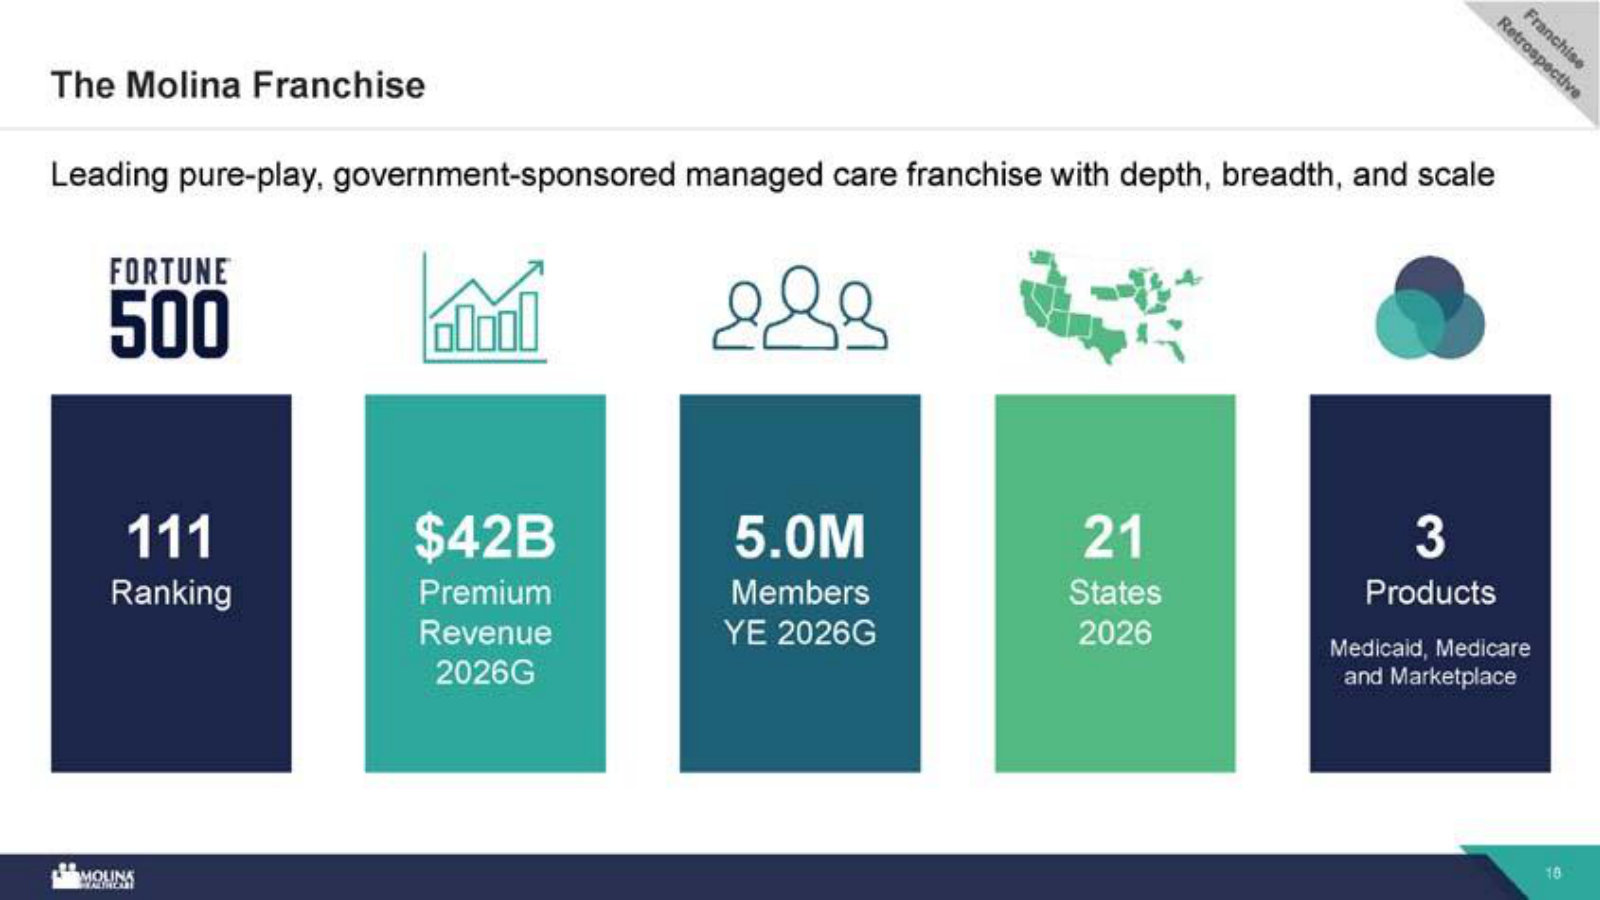
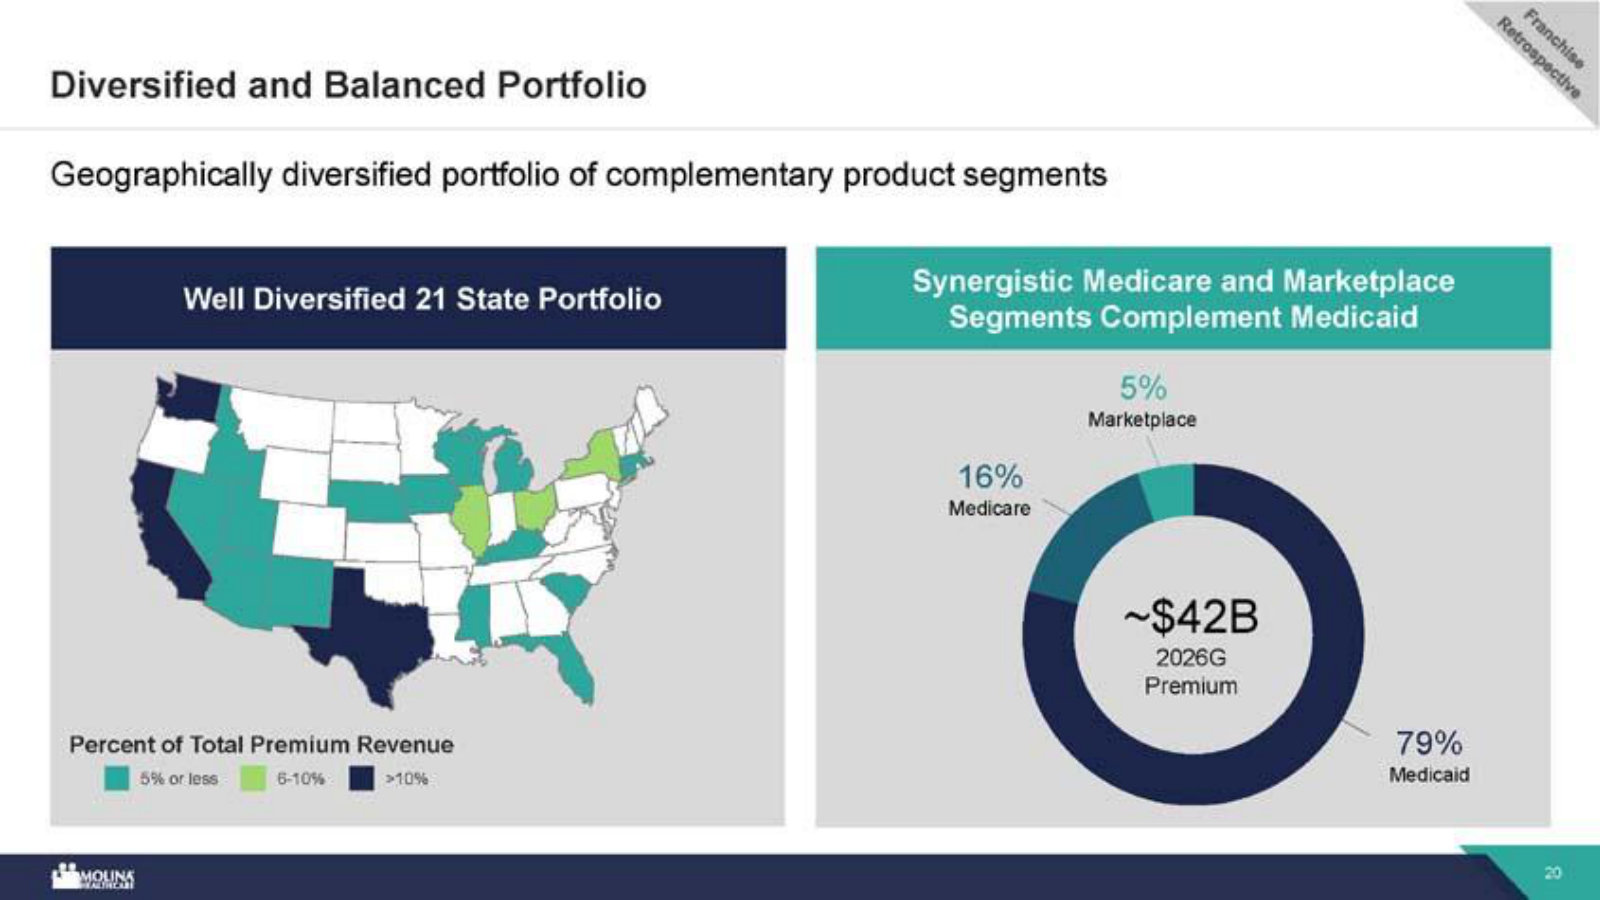
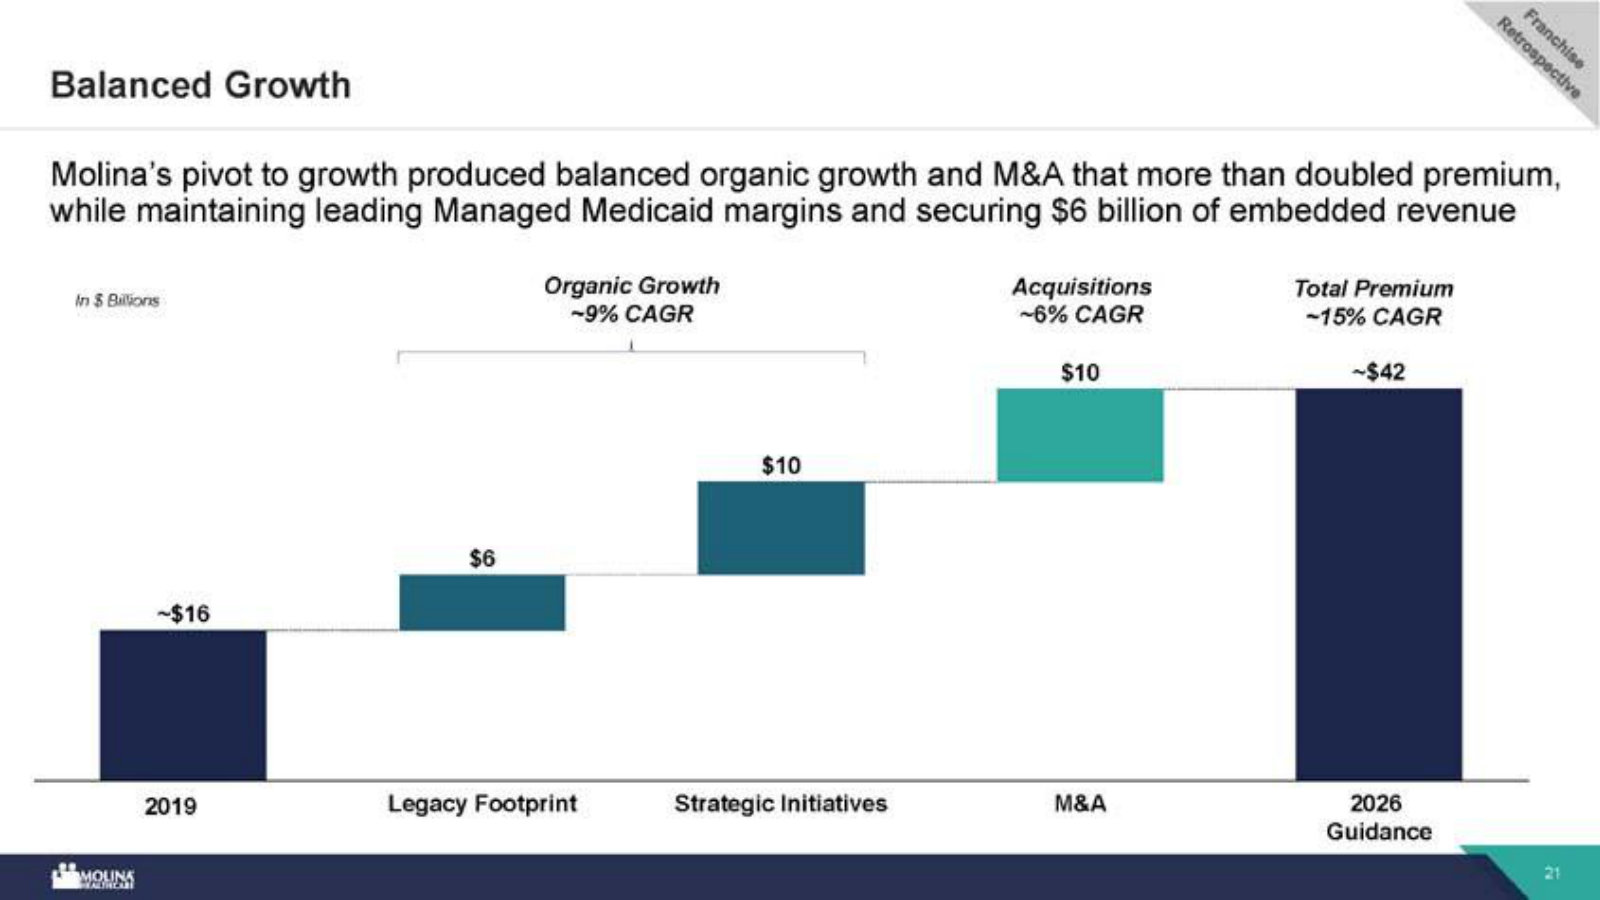
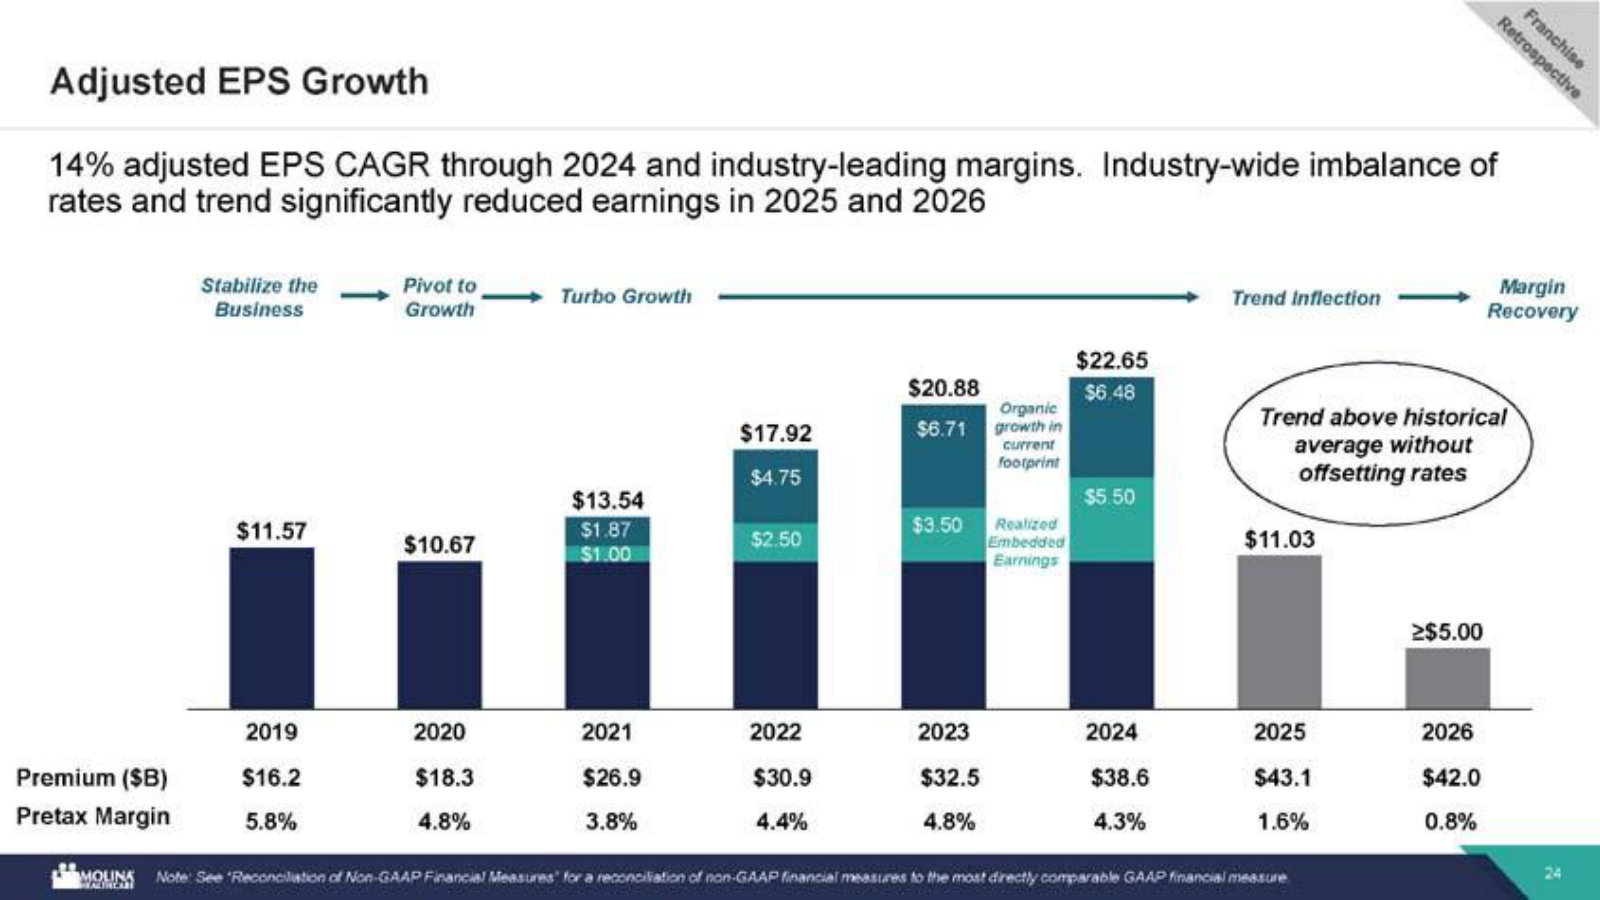
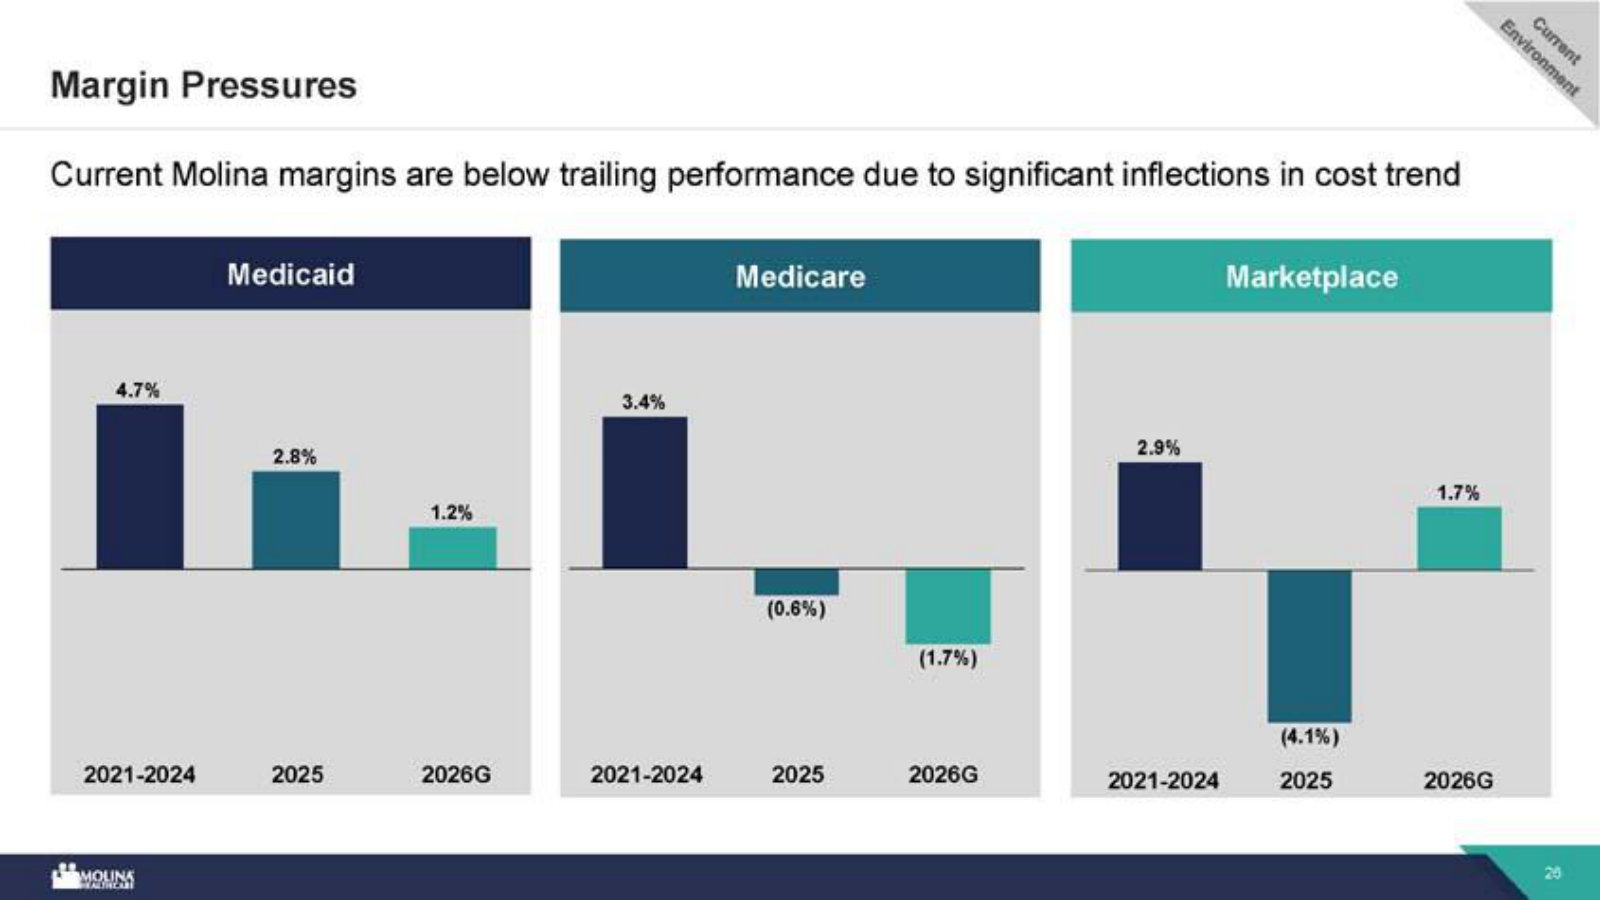
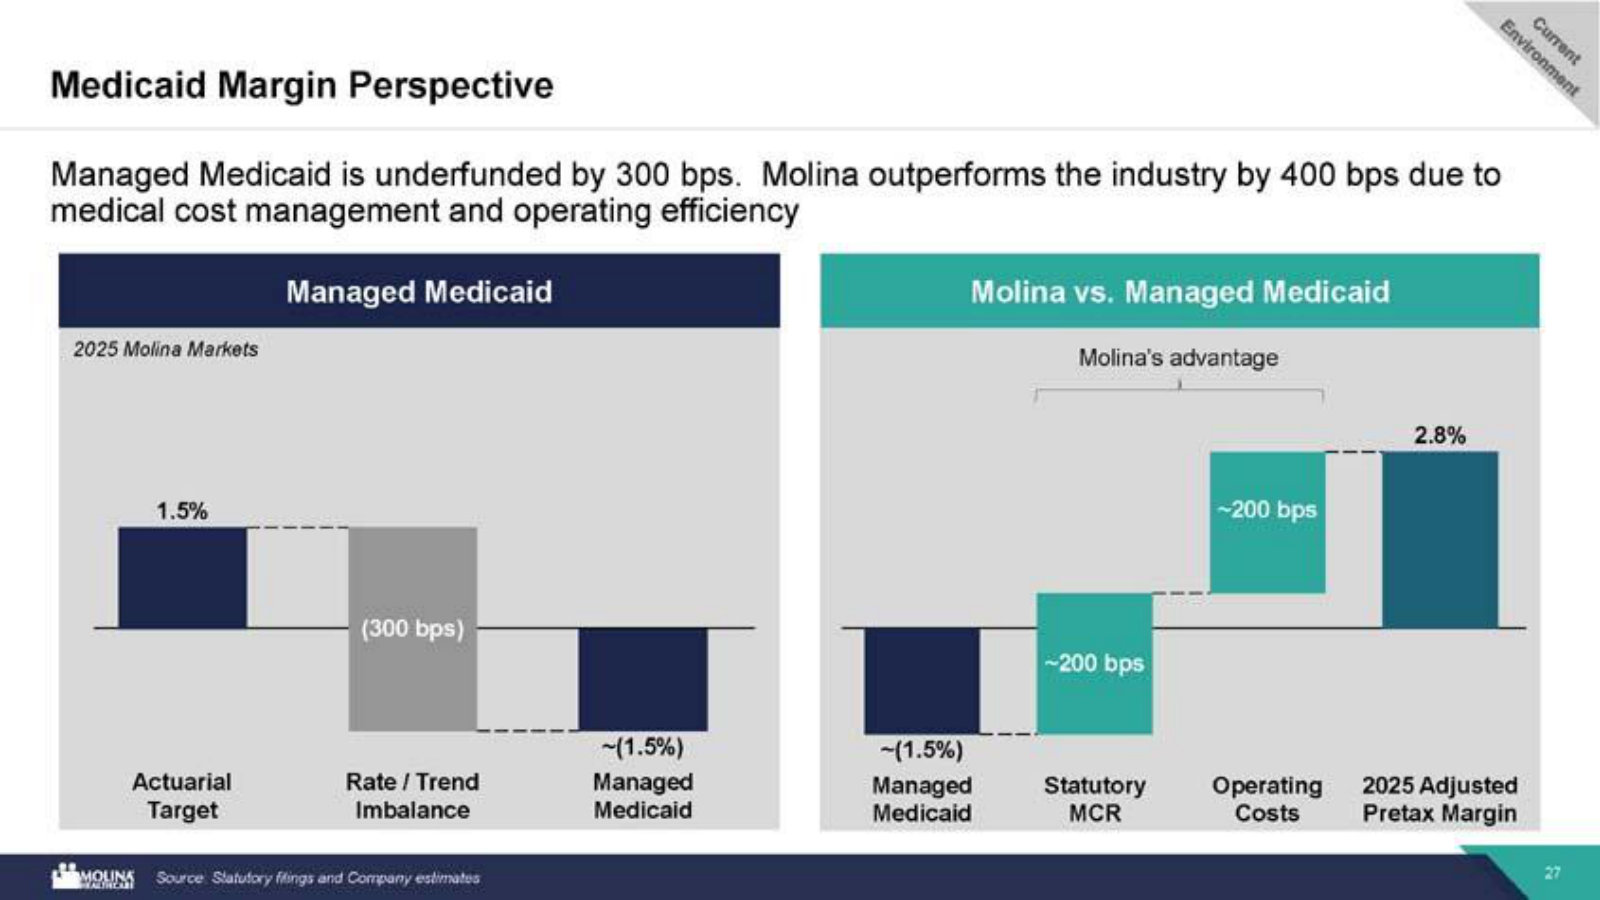
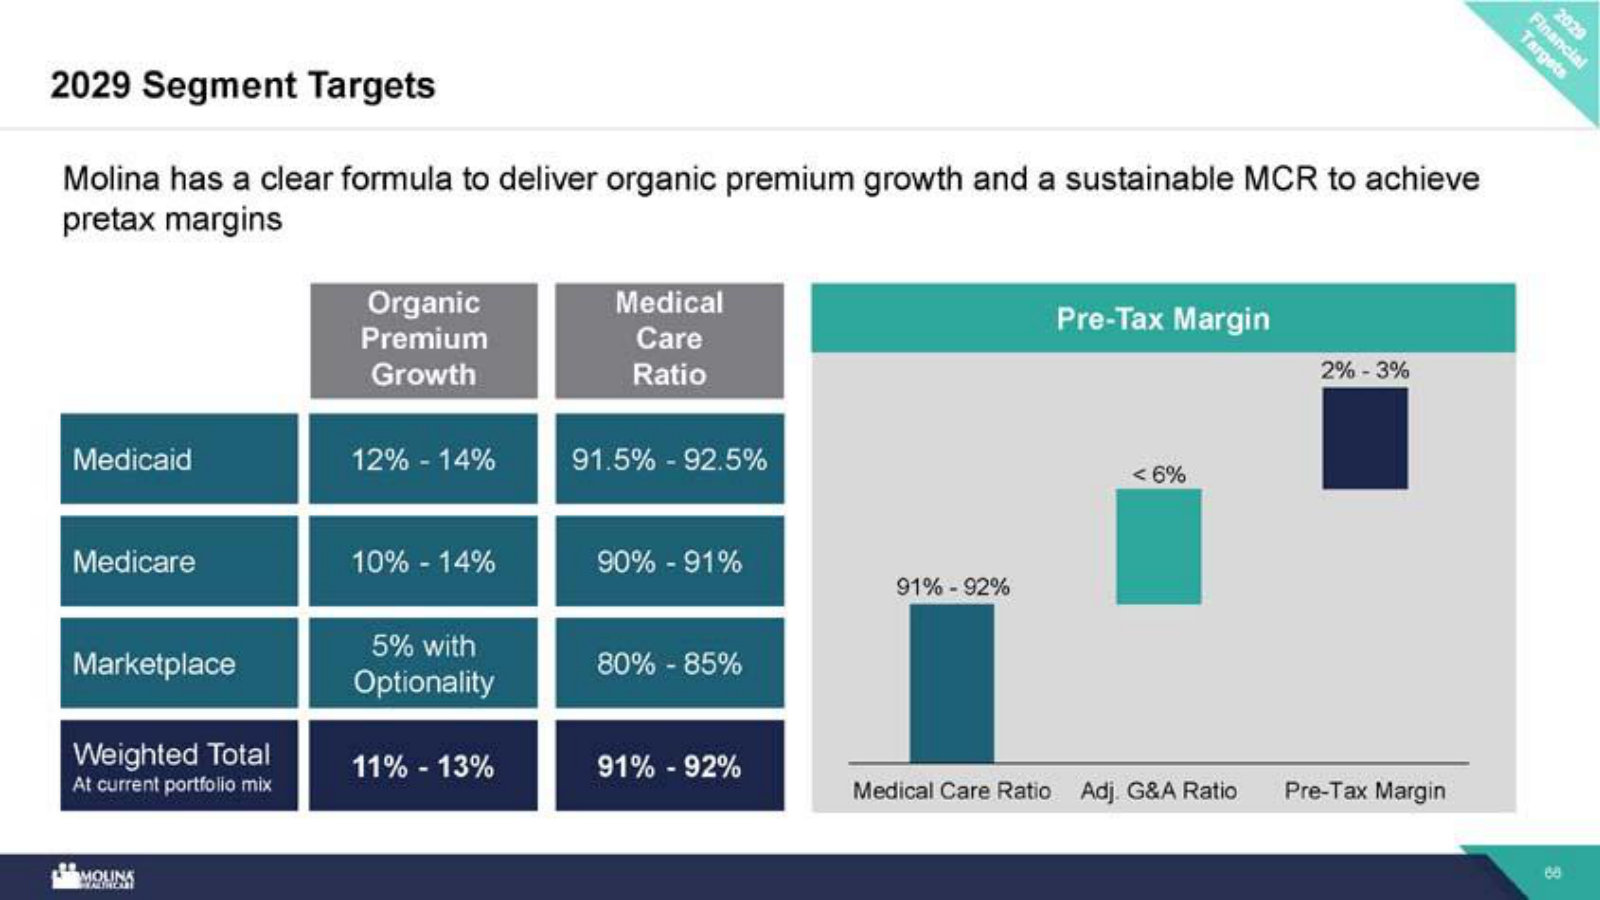
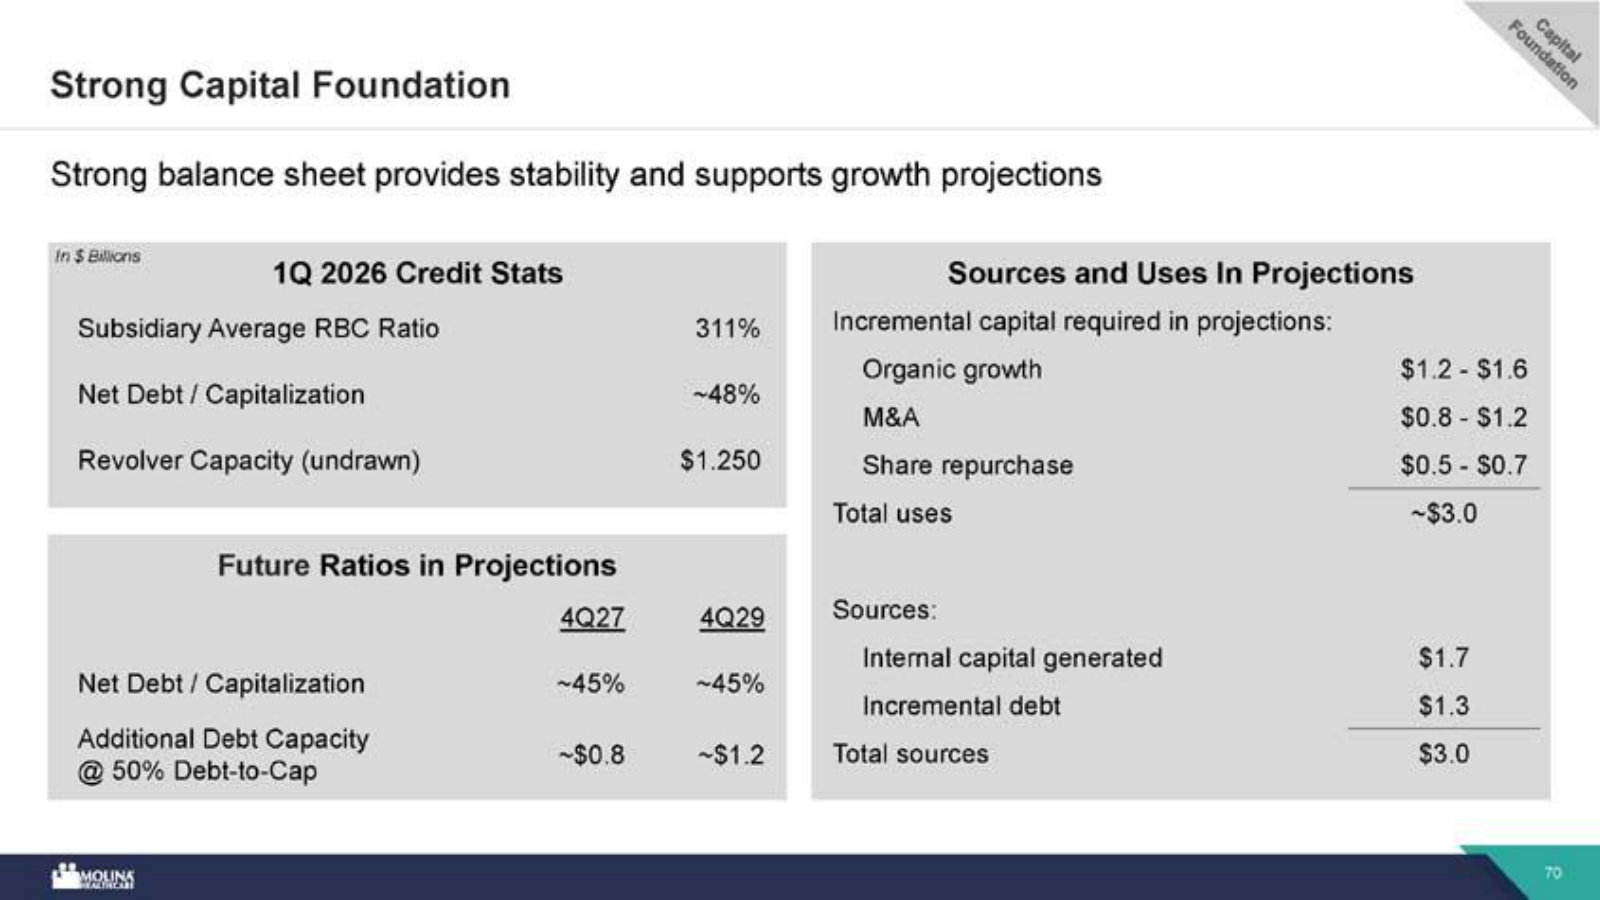
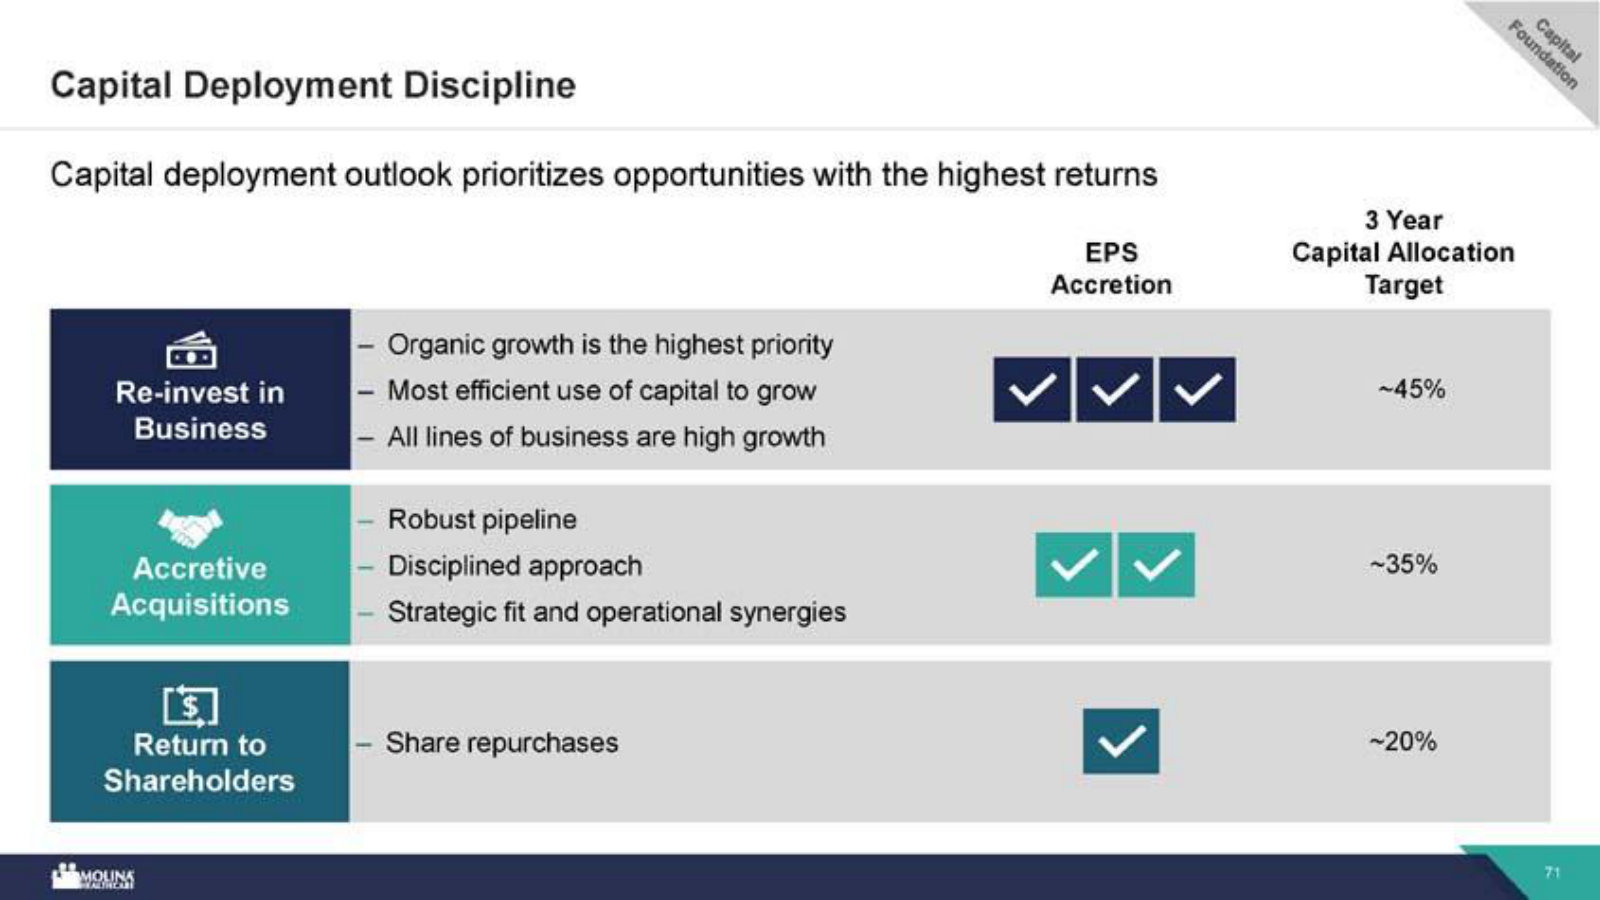
Management's fullest current statement: what Molina is, how the four growth engines work, why 2025's margins broke, and the path to $25 EPS by 2029. · Open the full document →
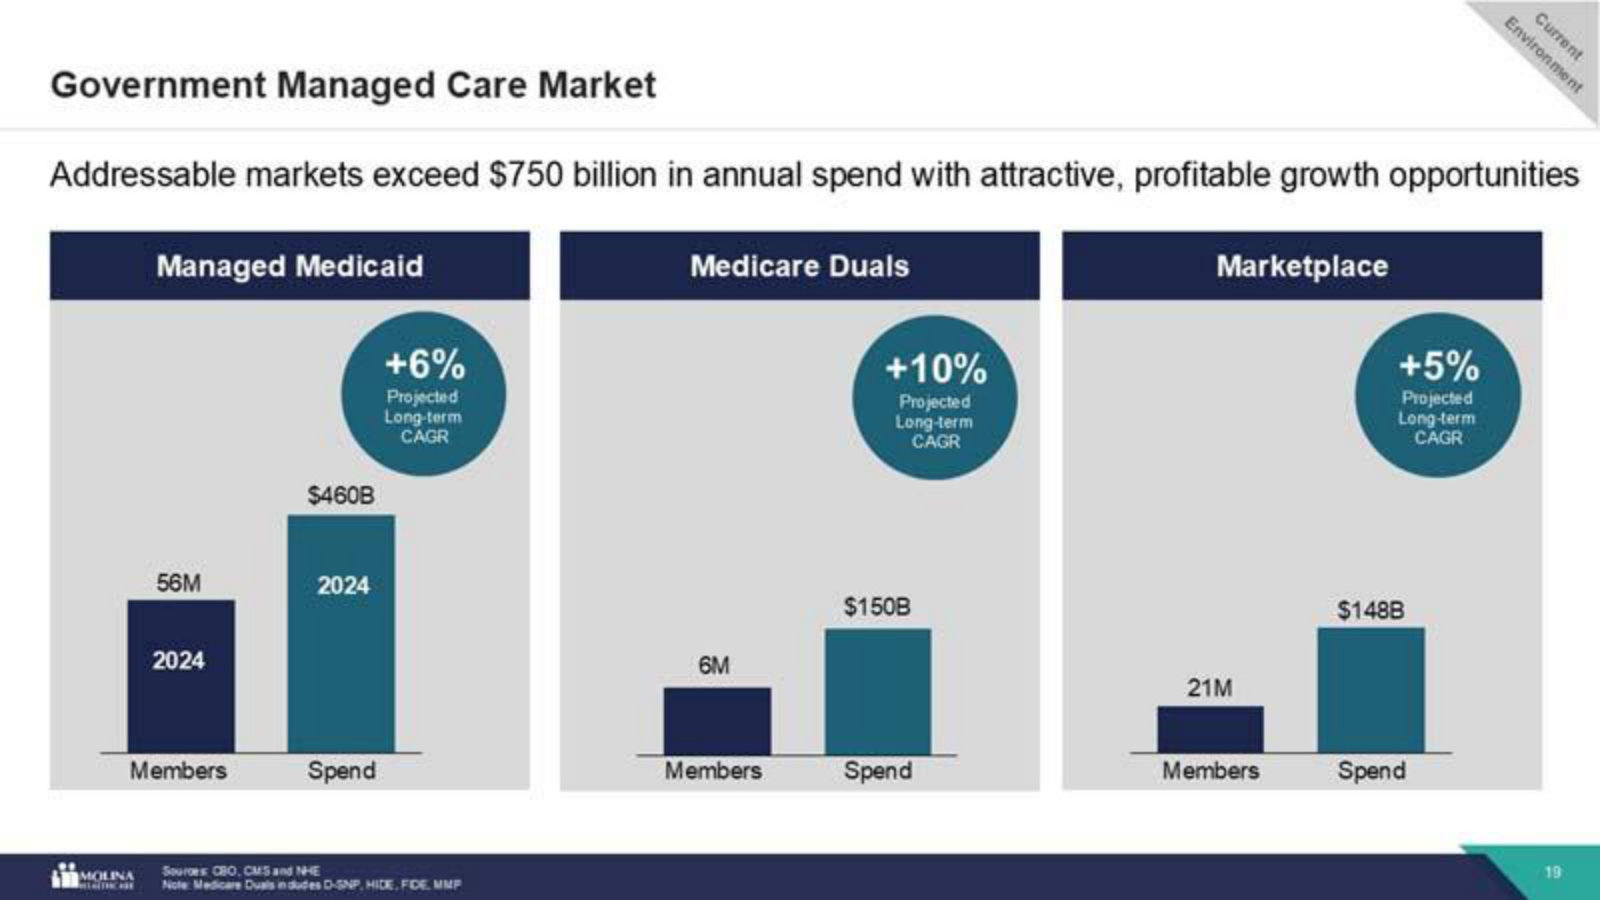
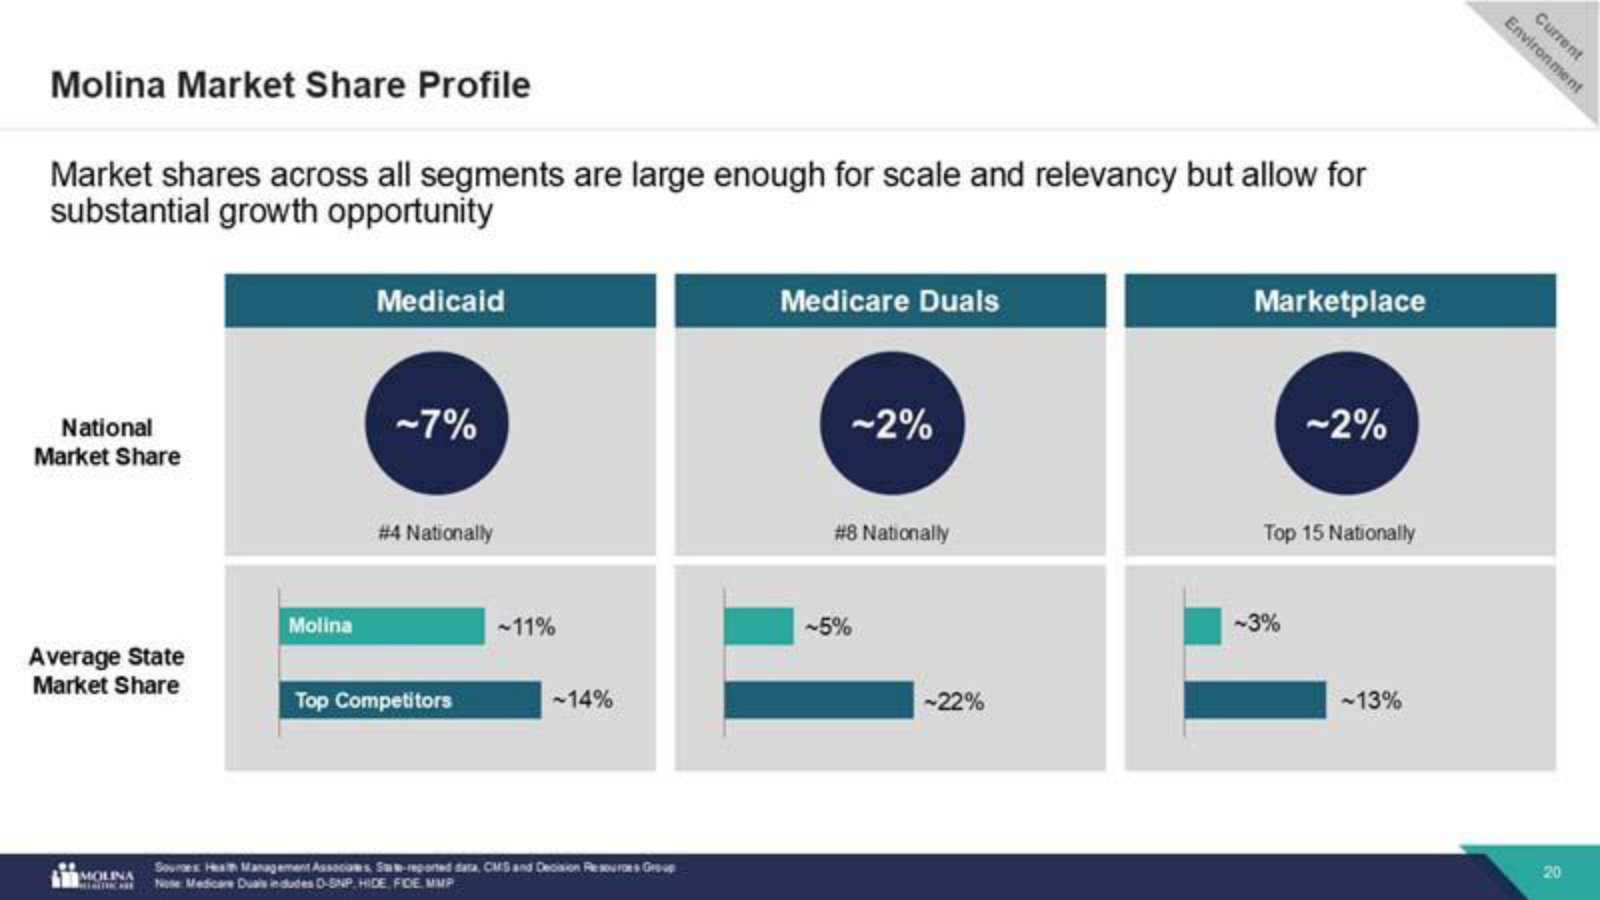
Investor Day 2024 — Value Creation: The Next Wave — 2024
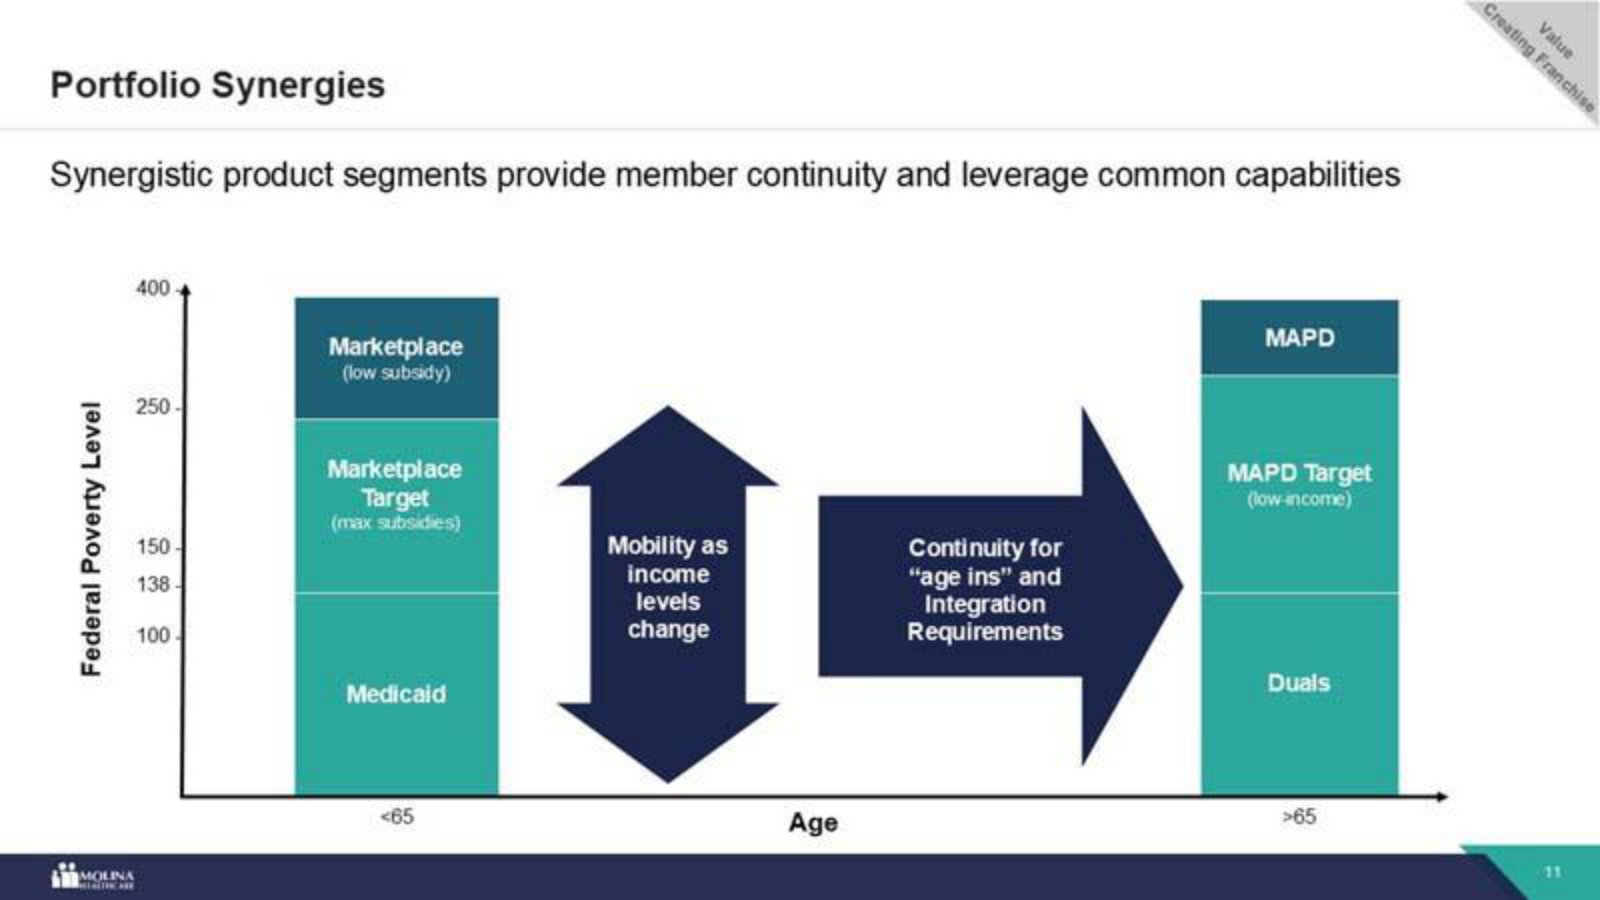
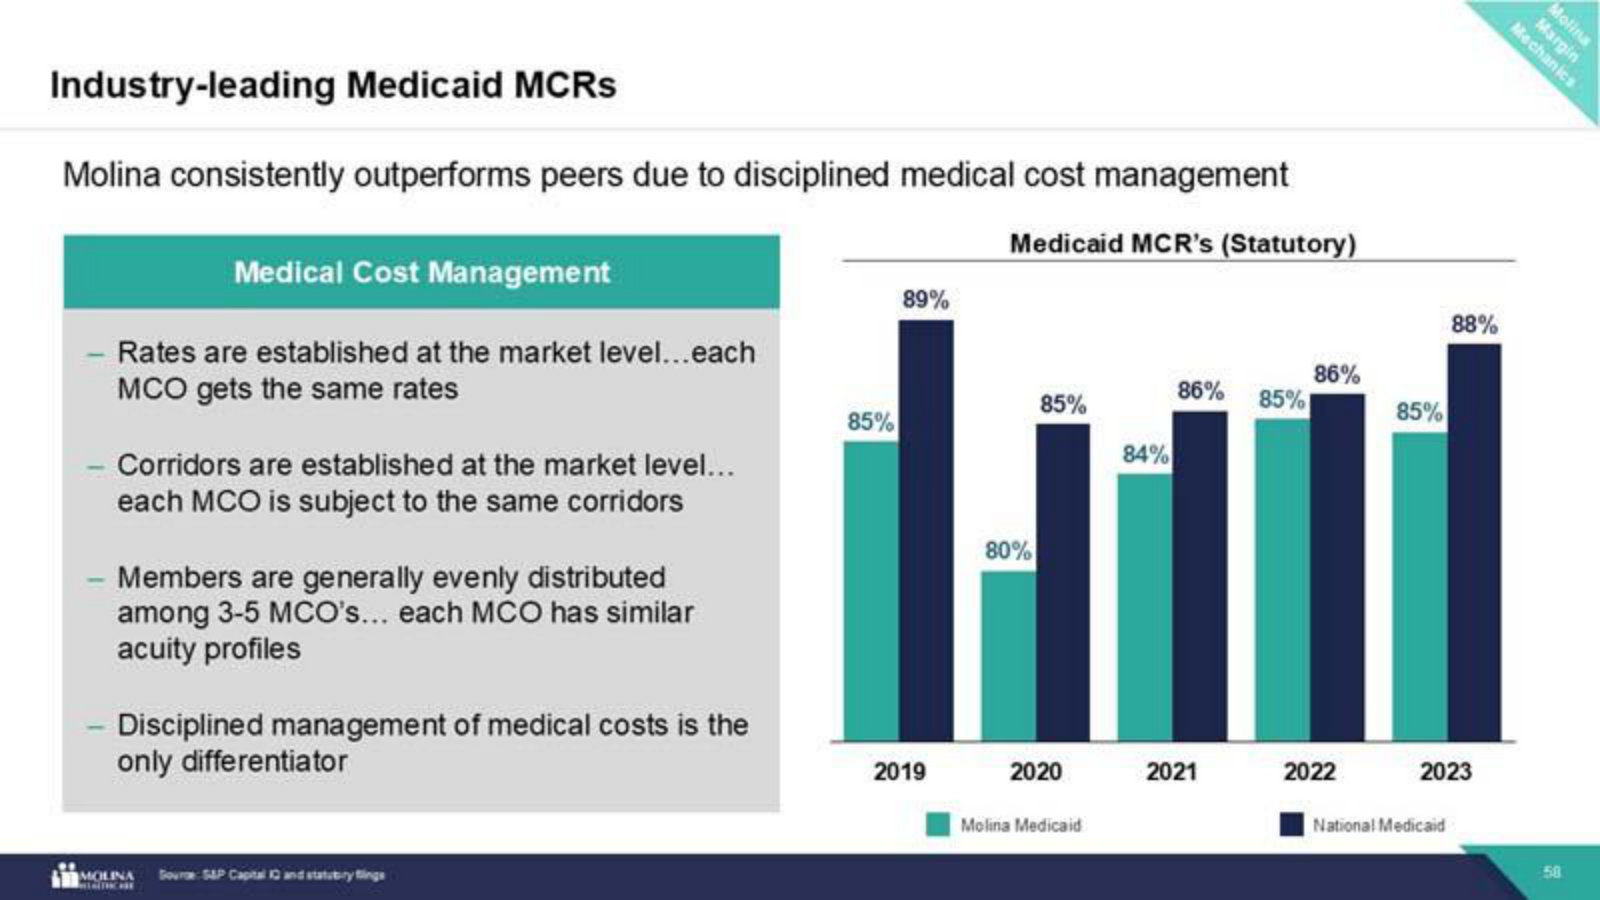
The prior investor day, mined here for its evergreen market-structure slides: TAM, market share, portfolio synergies and the MCR edge over peers. · Open the full document →
More from management
Investor Day 2023 — Sustaining Profitable Growth: The Next Wave — 2023 · 79 pages · The earlier investor day that set the $46B-by-2026 premium target and first laid out the four-engine growth model — the pre-downturn baseline. · Open →
Molina Healthcare, Inc.'s management answers for the business every quarter. These are the exchanges that explain it best — verbatim, from the call transcripts preserved in Sources. Each link opens the full transcript at that page in a new tab.
Q1 FY2026 Earnings Call — Q1 FY2026
The clearest post-shock read on how Molina’s Medicaid economics work — acuity, cost trend, and why management still refuses to raise guidance early. · Open the full transcript →
Why membership can fall without an acuity hit: the low/no-utilizer purge is done and leavers now depart at portfolio-average cost.
Mark Keim (CFO): Yes, absolutely, Andrew. The states Joe mentioned — California, Illinois, New York and Texas — are why we are expecting somewhat higher attrition this year. In California, the undocumented immigration status members are disproportionately driving that trend. Our prior guidance assumed membership attrition of 2% for the year; in the updated guidance it is now 6%, so membership volume will be lower. In our prepared remarks we noted that revenue would be offset by the marketplace. However, to Joe’s point about a potential acuity impact from higher Medicaid attrition, we are not seeing that. Most of the low- and no-utilizers left over the past 1.5 to 2 years since redetermination began after the pandemic, and today we have a smaller percentage of low and no users in our Medicaid population than we have ever recorded. Our stayers-versus-leavers analysis shows that those leaving Medicaid are leaving at rates very close to portfolio averages, which further suggests any pent-up acuity shift is largely behind us. So yes, Medicaid membership is lower, but we do not see an acuity impact.
p. 4 · Read in context →
Guidance philosophy: why a strong quarter still won’t move the full-year number until two quarters season.
Joseph Zubretsky (President and CEO); Kevin Fischbeck (Bank of America): Our prudent move to not increase guidance at the first quarter, even though the indicators are all positive for all 3 businesses are for vastly different reasons. In Medicaid, the volatility of the network cost inflection we experienced in late 2025, we had a very good trend result. In fact, the annualized trend result in the first quarter would indicate we might even come in less than 5% for the year, but we're not yet calling that. In Marketplace, we want to wait to see the June Wakely data before truing up our estimate for the full year. And we had a very, very good start in our new integrated products, our FIDE and HIDE in Medicare, but it's 1 quarter. It's a brand-new product, existing members, but a brand-new product. We want to see that develop for another quarter. We use the term time tested because I think it is prudent to see 6 months of results before updating our guidance, particularly coming off a highly volatile medical cost inflection environment in 2025, bearing in mind in Medicaid with a 92% result in the first quarter a 92.9% indication in our guidance for the full year, we can actually produce loss ratios north of 93% and still hit our guidance for the rest of the year. So cautious perhaps, but in this environment, we think it's entirely prudent to do so.
p. 5 · Read in context →
How the Medicare book is being rebuilt around duals — D-SNP, the converted HIDE/FIDE members, and the MAPD product being exited.
Joseph Zubretsky (President and CEO); Scott Fidel (Goldman Sachs): You're right to point out that the Medicare story is a little more complicated than most because it's a combination of our D-SNP product, which has been in force for many years; our MMP members who have now converted to HIDE and FIDE; and our MAPD product, which we are going to eliminate for 2027. We cited a drag on this year's earnings due to the MAPD product — I think we said it produced about a $1 earnings per share drag that won't repeat next year — and it is tracking to plan. D-SNPs have always produced a modest profit and continue to. The surprise, if there was one, is that we took a very cautious approach to converting 80,000 members and over $2 billion of revenue to HIDE and FIDE, which are highly competitive new products under a new rating regime. They performed much better out of the gate than we had anticipated, but that's just one quarter, so we'll be cautious about updating guidance for the full year on that product. In 2027 and beyond we'll only be talking about duals: D-SNP and HIDE and FIDE combined as a dual segment, which will be a lot easier to follow. Those are the three pieces, and they will have different dynamics for different reasons.
p. 8 · Read in context →
Capital allocation: buying distressed plans near book value can beat a new contract win because the capital is all regulatory, not goodwill.
Joseph Zubretsky (President and CEO); John Stansel (JPMorgan): Our M&A pipeline is full of actionable opportunities. We'll remain disciplined and focus on properties that fit our core strategy. Mark and I debate this often: historically we paid around 22 to 23 percent of revenue, but book value now seems the best benchmark. If you're only paying for regulatory capital, an M&A deal can be as good as, if not better than, a new contract win.
p. 9 · Read in context →
Unit economics: the cost base is 20% higher than three years ago, and Molina runs 300-400 bps better than the market as states catch up.
Joseph Zubretsky (President and CEO); Lance Wilkes (Bernstein): Generally speaking, we're seeing states step up to the reality that a cost inflection has occurred and they are catching up to it. What do they need to catch up to? If you look at the trends we've experienced over the past three years, 4.5, 6.5 and 7.5, the cost baseline is 20% higher than it was three years ago. That's what they need to catch up to. Now we believe we're operating 300 to 400 basis points better than the average market. So as they catch up, we should be moving into much more positive territory than we already are. Bearing in mind, our guidance in Medicaid is for a 1.5% pretax margin this year, eliminating the impact of Florida Kids.
p. 11 · Read in context →
Q3 FY2025 Earnings Call — Q3 FY2025
The second guidance cut of the year and the sharpest map of the recovery — how underfunded rates catch up, why the exchange book is being shrunk, and how Molina buys revenue at book value. · Open the full transcript →
The framing that anchors the thesis: a rate-trend dislocation is inclement weather, not climate change — temporary, not permanent.
Joseph Zubretsky (CEO): At our last Investor Day, we characterized this environment as inclement weather rather than climate change, metaphorically meaning temporary rather than permanent. We continue to believe this to be true.
p. 3 · Read in context →
The deliberate exchange retreat: 30% average 2026 rate hikes, a 20% smaller footprint, top-2 pricing dropping from 50% of markets to ~10%.
Mark Keim (CFO): Our 2026 rate increases averaged 30%, ranging from 15% to 45%, and we have exited difficult geographies. I will note that for the next year, we have reduced our county footprint by 20%, and our #1 and #2 price position is going from 50% of our footprint in 2025 to an estimated 10% of our footprint in 2026.
p. 4 · Read in context →
The recovery math: the market needs 300-500 bps of rate to break even, but Molina runs 200-300 bps ahead, so it needs only a fraction.
Joseph Zubretsky (CEO); Joshua Raskin (Nephron Research): The market in Medicaid needs 300 to 500 basis points to break even, just to break even. We've consistently operated 200 to 300 basis points better than the competitors in all of our markets. We only need a fraction of what the market needs in order to get back to target margins.
p. 7 · Read in context →
The M&A model in one answer: $11B of revenue acquired over ~8 deals at 22% of revenue — mostly hard regulatory capital, near book value.
Joseph Zubretsky (CEO); John Stansel (JPMorgan): On the M&A pipeline, if you look at our history of purchasing, what, $11 billion of revenue over 7 or 8 deals and only acting capital equal to 22% of purchase revenue, half of which is regulatory capital, hard capital we barely paid any goodwill value for the acquisitions. In this period of cyclically low margins, we're going to be very disciplined about prices paid for revenue streams. If you can buy a revenue stream from a struggling local health plan at or about book value, it's just as good as winning a new contract, no goodwill capital.
p. 10 · Read in context →
How Medicaid rates actually get set: the look-back start date matters less than the trend factor layered on top of it.
Mark Keim (CFO); Michael Ha (Baird): And Joe, that's a big point that isn't always well understood. If the look-back period is 6 months or 12 months ago, sure, that makes a difference from one perspective, but that's not the rate you get. The rate you get is that look back starting point plus a fair trend on top of it. Now actuaries can argue over what that fair trend is on top of it. But if that fair trend comes out at an appropriate place, the specific data, the look-back period is less relevant.
p. 13 · Read in context →
Q2 FY2025 Earnings Call — Q2 FY2025
The call where the thesis first broke — a $5.50 guidance cut — and where management laid bare the rate/trend/corridor machinery and its “small, silver and stable” exchange discipline. · Open the full transcript →
How the dislocation built quarter by quarter as rising trend outran each rate update and drained the risk corridors.
Joseph Michael Zubretsky (President and CEO): Starting in the third quarter of 2024, while an increasing trend emerged from the end of the redetermination process, rates and Molina's risk corridor positions at the time were sufficient to offset that increasing trend. By the fourth quarter of 2024, the increasing medical cost trend moved beyond the 2024 midyear rate updates, and corridors have largely become depleted. Moving into the first quarter of 2025, the January 1 rate cycle captured much of the continued trend pressure. And now in the second quarter of 2025, we experienced yet another increase in trend, which moved beyond the rate updates received in the first quarter, and risk corridor protection at this point is very limited and isolated.
p. 2 · Read in context →
Why Marketplace is deliberately capped at 10% of the portfolio: inherent volatility and a constantly shifting risk pool.
Joseph Michael Zubretsky (President and CEO): Our small, silver and stable approach to this line of business, where we target mid-single-digit margins even at the expense of growth, was deliberate and well considered. This line of business has significant inherent volatility and a constantly shifting risk pool. We have limited this segment to just 10% of our portfolio, and we always approach it cautiously.
p. 3 · Read in context →
Why risk adjustment stopped protecting the exchange book: the whole national risk pool is 8% more acute year-over-year.
Joseph Michael Zubretsky (President and CEO); Joshua Raskin (Nephron Research): The acuity of the entire marketplace risk pool is higher by 8% year-over-year, which means on a relative basis, risk adjustment is not going to keep up with the elevated trend.
p. 7 · Read in context →
The distance to target margin, spelled out: 190 bps over the range, needing ~200 bps of rate on top of trend to get back.
Joseph Michael Zubretsky (President and CEO); Kevin Fischbeck (Bank of America): Currently, we are operating at a 91% medical cost ratio, which is 190 basis points above the upper limit of our range. To reach our target margin, we need an additional 200 basis points on top of the trend. Based on external evaluations, we believe that the wider market will require even more than this. If we can secure those extra 200 basis points along with an appropriate trend, we should be able to return to our target margin.
p. 11 · Read in context →
What embedded earnings is: $8.65 built from $2.25 of acquisitions, $5.40 of contract wins, and $1 of reversing implementation costs.
Mark Keim (CFO); Jason Cassorla (Guggenheim): So the $8.65 is comprised of about $2.25 from acquisitions and about $5.40 from new contract wins. You add in $1 of the implementation cost that's in our P&L this year that just automatically reverse next year. Those are the components that get you to $8.65 million. Now the good news, and Joe pointed this out, is the dollar has no execution risk. It just happens.
p. 15 · Read in context →
Q4 & Full Year 2024 Earnings Call — Q4 FY2024
The pre-storm annual call that lays out the whole growth algorithm — 19% premium growth, the $46B/$52B revenue targets, embedded earnings, and how rates, trend and corridors fit together. · Open the full transcript →
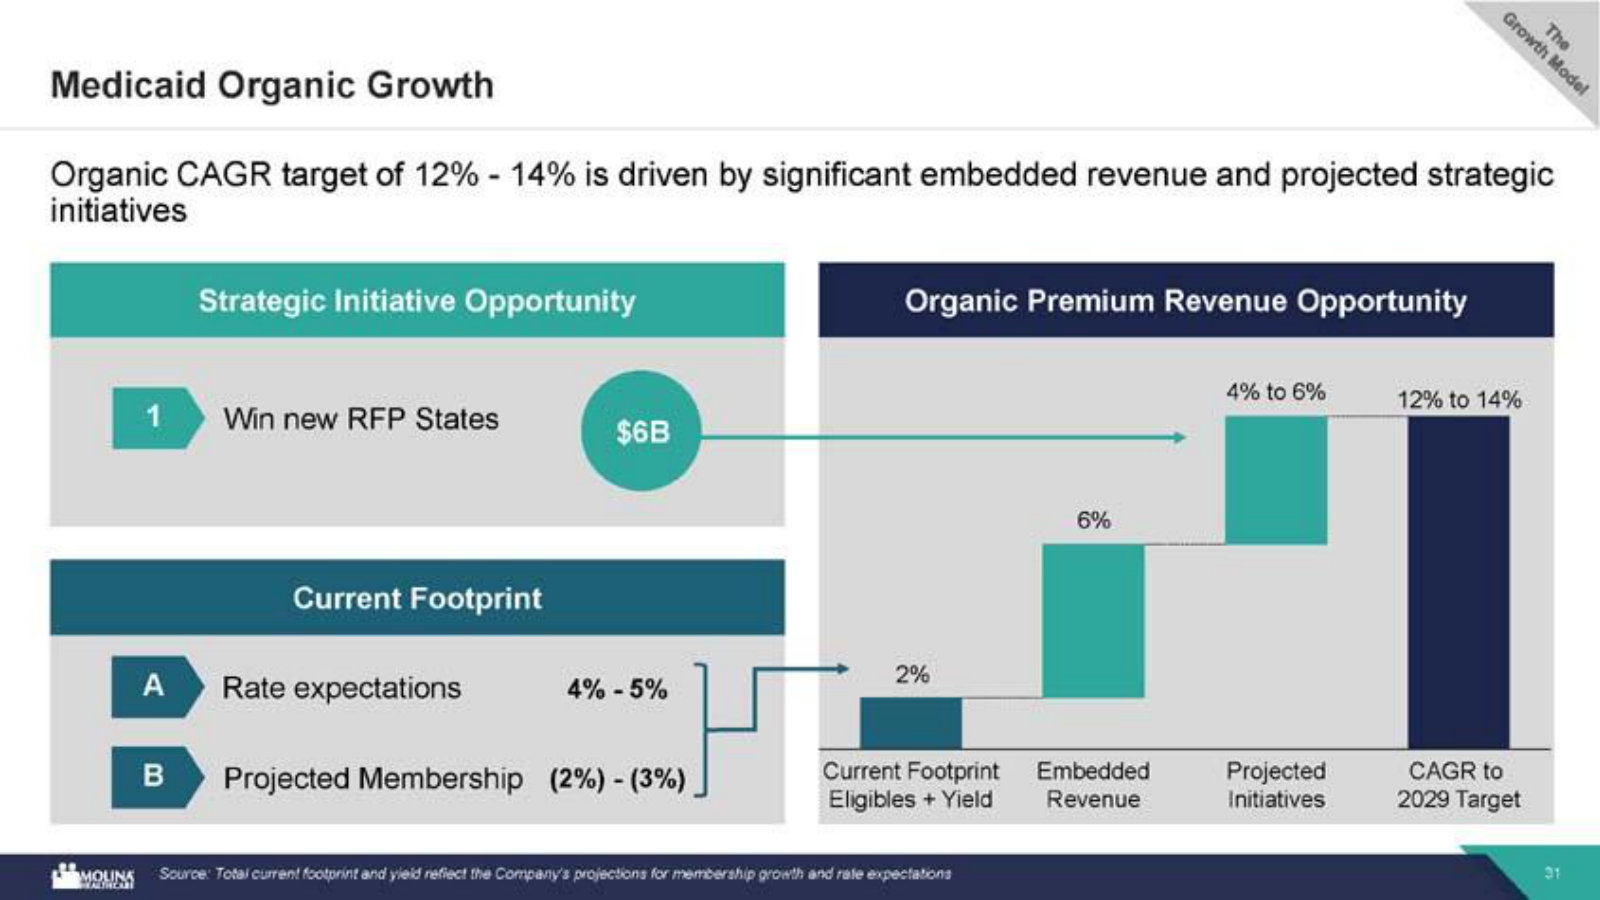
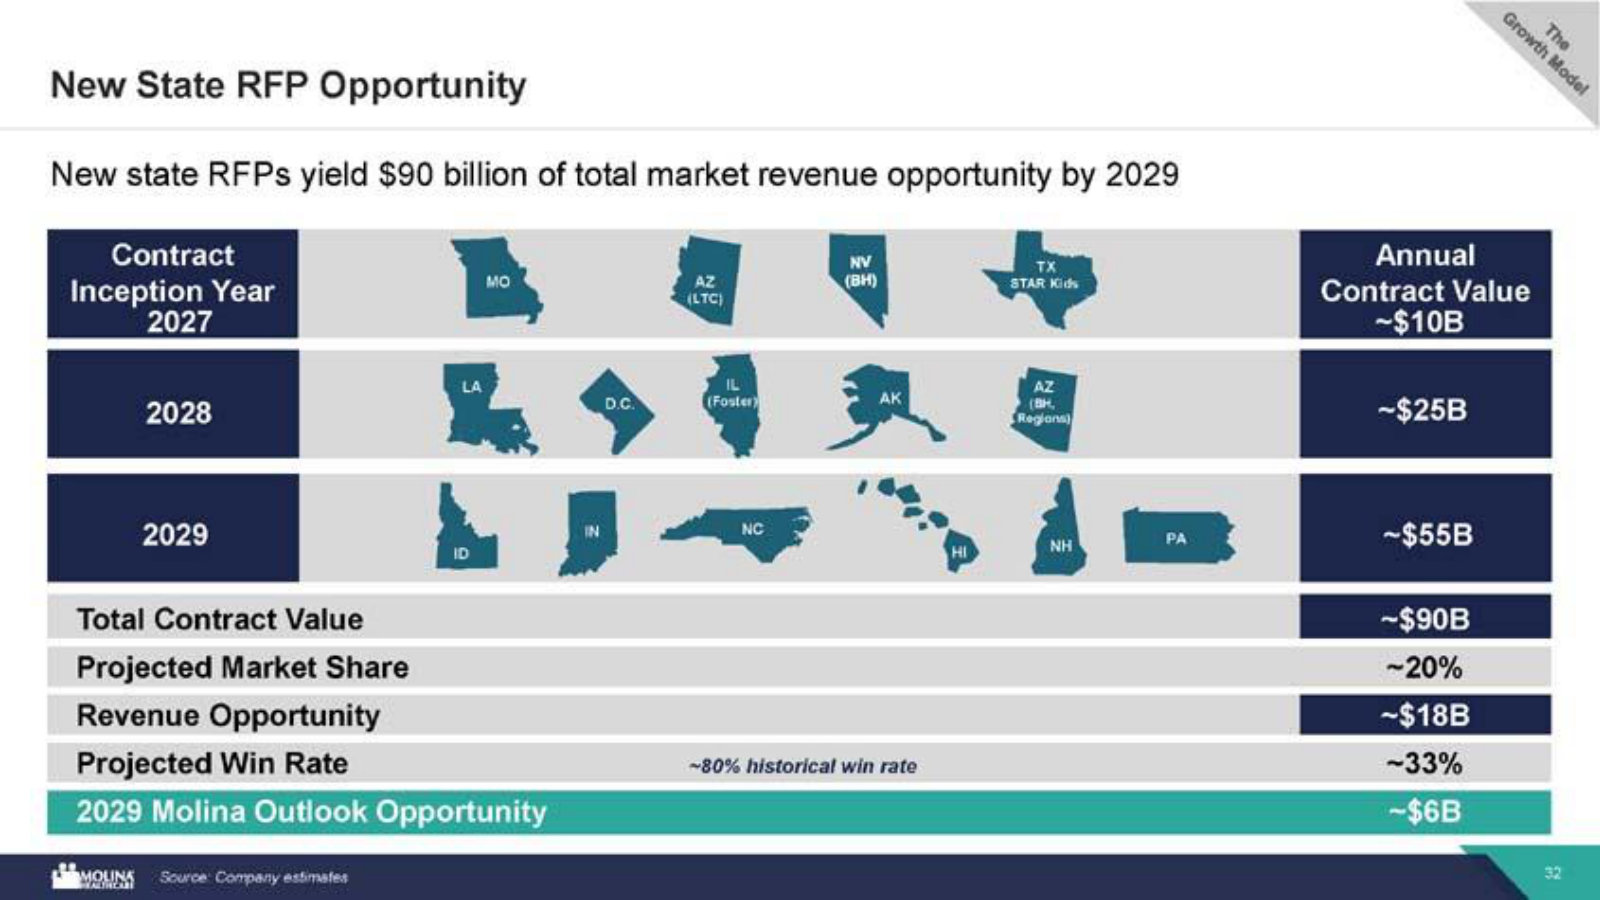
The growth algorithm: wins and acquisitions put Molina on a path to $46B (2026) and $52B (2027); embedded earnings ~30% of run-rate EPS.
Joe Zubretsky (CEO): we are well on our way to meeting our target of $46 billion premium revenue in 2026, and at least $52 billion in 2027. With our current footprint contributing its average annual growth, and now fully considering all of our recent growth successes, the path to achieve these growth milestones is very clear. And most importantly, all of this recent activity has allowed us to increase our embedded earnings to $7.75 for 2026 and beyond, after harvesting $1.50 of embedded earnings in our 2025 guidance. Having embedded earnings of at least 20 to 25% of run rate EPS is an attractive benchmark to support future EPS growth. Now at approximately 30%, we are very well positioned to meet our long-term targets.
p. 2 · Read in context →
The exchange playbook before the pool turned: two years of double-digit margins reinvested into pricing to grow.
Joe Zubretsky (CEO): Finally, in Marketplace, we are projecting to grow premium at 60% in total, half of which is organic. Two consecutive years of exceeding target margins have allowed us to reinvest several hundred basis points of excess margin into pricing in order to grow.
p. 2 · Read in context →
How risk corridors really work — an imperfect hedge that only helps where trend pressure and remaining corridor protection line up.
Mark Keim (CFO); Andrew Mok (Barclays): We're in 21 states. And the benefit of the corridor is not evenly distributed across 21 states. So what really matters is where does the trend pressure show up versus where is corridor protection remaining. That could either help you significantly or it can leave you no benefit, which is more or less what happened in the fourth quarter.
p. 6 · Read in context →
Decomposing medical cost trend: 2024’s 6.5% was half redetermination acuity, half core utilization — and the acuity half does not recur.
Joe Zubretsky (CEO); Sarah James (Cantor Fitzgerald): In 2024, in Medicaid, our full cost trend was 6.5%, half of which was the acuity shift to redetermination and half of which is what we call core utilization, high utilization of the continuing population. Comparing that to the 4.5% trend in 2025, the acuity shift doesn't recur.
p. 8 · Read in context →
The regulatory thesis: any real Medicaid cut forces a politically untenable choice, so changes to managed Medicaid should be marginal.
Joe Zubretsky (CEO); A.J. Rice (UBS): The issue is what are you going to reduce in terms of where the money goes? […] Neither side of the aisle wants to see more uninsured. It's below ten percent of eligibles for the first time in decades. Reduction in benefits. Reduction in enrollment, reduction in payments to providers, or none of the above. And I either have to, as a state, decrease my education budget or raise taxes. None of those solutions is politically tenable. That's why we conclude that any changes to manage Medicaid as we know it today would be marginal.
p. 11 · Read in context →
More calls
Q1 FY2025 Earnings Call — Q1 FY2025 · 12 pages · The last call before the mid-2025 reset — management still reaffirming $24.50 and the embedded-earnings growth story just before trend broke it. · Open →
Q3 FY2024 Earnings Call — Q3 FY2024 · 14 pages · Where the cost inflection first surfaced in the continuing Medicaid population, beyond the redetermination acuity shift. · Open →
Q2 FY2024 Earnings Call — Q2 FY2024 · 13 pages · A mid-redetermination read on how acuity shift, rates and corridors were still holding Medicaid MCR near target. · Open →
Q1 FY2024 Earnings Call — Q1 FY2024 · 12 pages · The early-redetermination baseline: the operating model running to plan before the trend environment turned. · Open →
Q4 & Full Year 2023 Earnings Call — Q4 FY2023 · 13 pages · Where the $46B/$52B multi-year growth targets and the embedded-earnings framework were first laid out in detail. · Open →
Q3 FY2023 Earnings Call — Q3 FY2023 · 12 pages · Peak-redetermination membership dynamics and how Molina reaffirmed its long-term compound growth target through the unwind. · Open →
Q2 FY2023 Earnings Call — Q2 FY2023 · 15 pages · The height of the Medicaid redetermination unwind — the clearest early framing of how acuity and rate corridors protect the book. · Open →
Molina Healthcare, Inc.'s annual reports contain management's most considered account of the business. These are the sections, passages and visual pages worth opening in the originals preserved in Sources.
Molina Healthcare, Inc. — FY2025 Annual Report (Form 10-K) — FY2025
The latest 10-K: management's account of a hard 2025 — record revenue, but a sharp margin and earnings decline as medical costs outran rates. · Open the full document →
Item 1. Business — p. 7 · Read the full section →
How Molina earns: fixed government premiums across four programs — Medicaid, Medicare, Marketplace — for 5.5M members in 21 states.
Item 1. Business — Trends and Uncertainties — p. 23 · Read the full section →
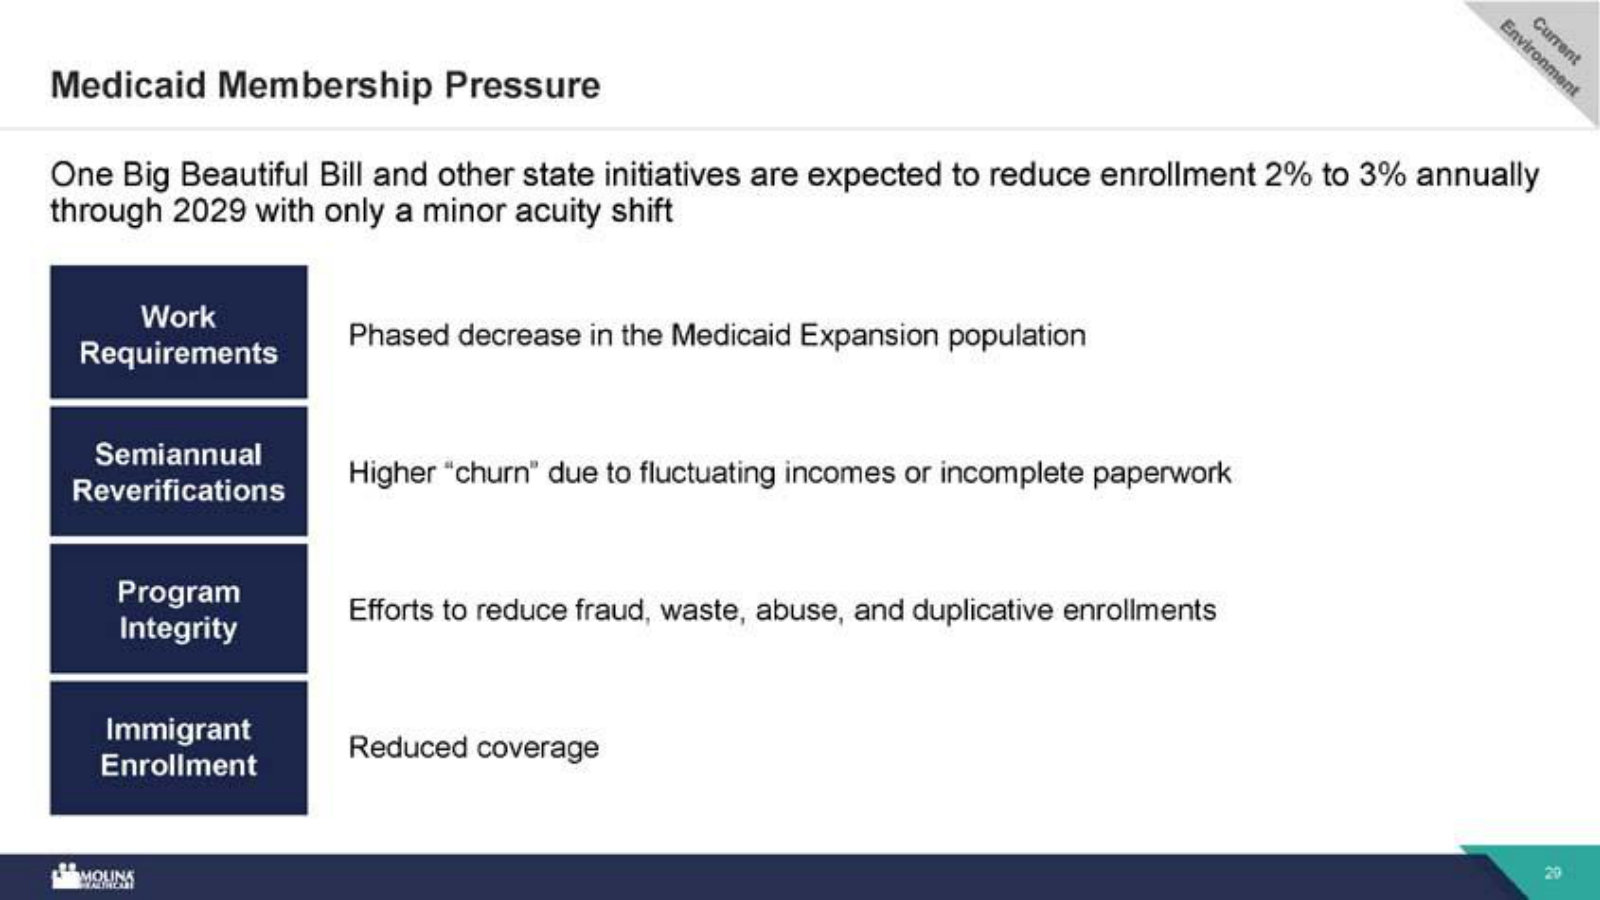
The regulatory forces reshaping the near-term earnings base: OBBBA Medicaid cuts and the 2025 expiration of Marketplace subsidies.
Management sizes OBBBA: a 15–20% cut to 1.2M Medicaid Expansion members by 2029, plus Marketplace enrollment pressure.
The President signed the OBBBA into law in July 2025, which contains changes to the Medicaid and Marketplace programs. […] We currently estimate the reduction in enrollment will be in the range of 15% to 20% by 2029 on 1.2 million members in our Medicaid Expansion population, and any acuity shifts should be modest and gradual. […] The law limits which legal aliens may be eligible for Marketplace PTCs and will require pre-enrollment eligibility verification for enrollees to receive PTCs. These changes are planned to be phased in over the period from 2026 to 2028 and are expected to reduce national Marketplace enrollment as well.
p. 23 · Read in context →
Item 1A. Risk Factors — p. 39 · Read the full section →
The two risks that actually bite this insurer: state rates lagging cost trend, and a volatile Marketplace book that is hard to price.
Core margin risk: premiums are fixed by contract and reset only annually, so when costs outrun rates the medical margin compresses.
Our premium revenues consist of fixed monthly payments per member, and supplemental payments for other services such as maternity deliveries. These premiums are fixed by contract, and we are obligated during the contract periods to provide healthcare services as established by the state governments in which our health plans operate. Rate increases are most typically implemented by states on only an annual basis. We use most of our premium revenues to pay the medical costs of healthcare services delivered to our members. If the premiums paid to us are not increased at a rate that is commensurate with the rate at which medical expenses related to healthcare services rise, or the rate at which health care utilization rates increase, our medical margins will be compressed or eliminated, and our earnings will be negatively affected.
p. 39 · Read in context →
Marketplace is price-sensitive and volatile — and the APTC subsidies most members relied on expired at the end of 2025.
Marketplace plan selection by members is highly price sensitive, and the Marketplace markets in general are highly volatile and unpredictable from year to year. In recent years, most of our Marketplace members were eligible to receive government-subsidized premium subsidies. Even though certain advanced premium tax credits (“APTCs”) expired at the end of 2025, it is possible that they could be renewed, but the timing of such a decision, and the manner in which they could be renewed, is uncertain.
p. 39 · Read in context →
Item 7. Management's Discussion and Analysis — p. 77 · Read the full section →
Where management explains the 2025 miss: operating income more than halved as the medical care ratio rose across every segment.
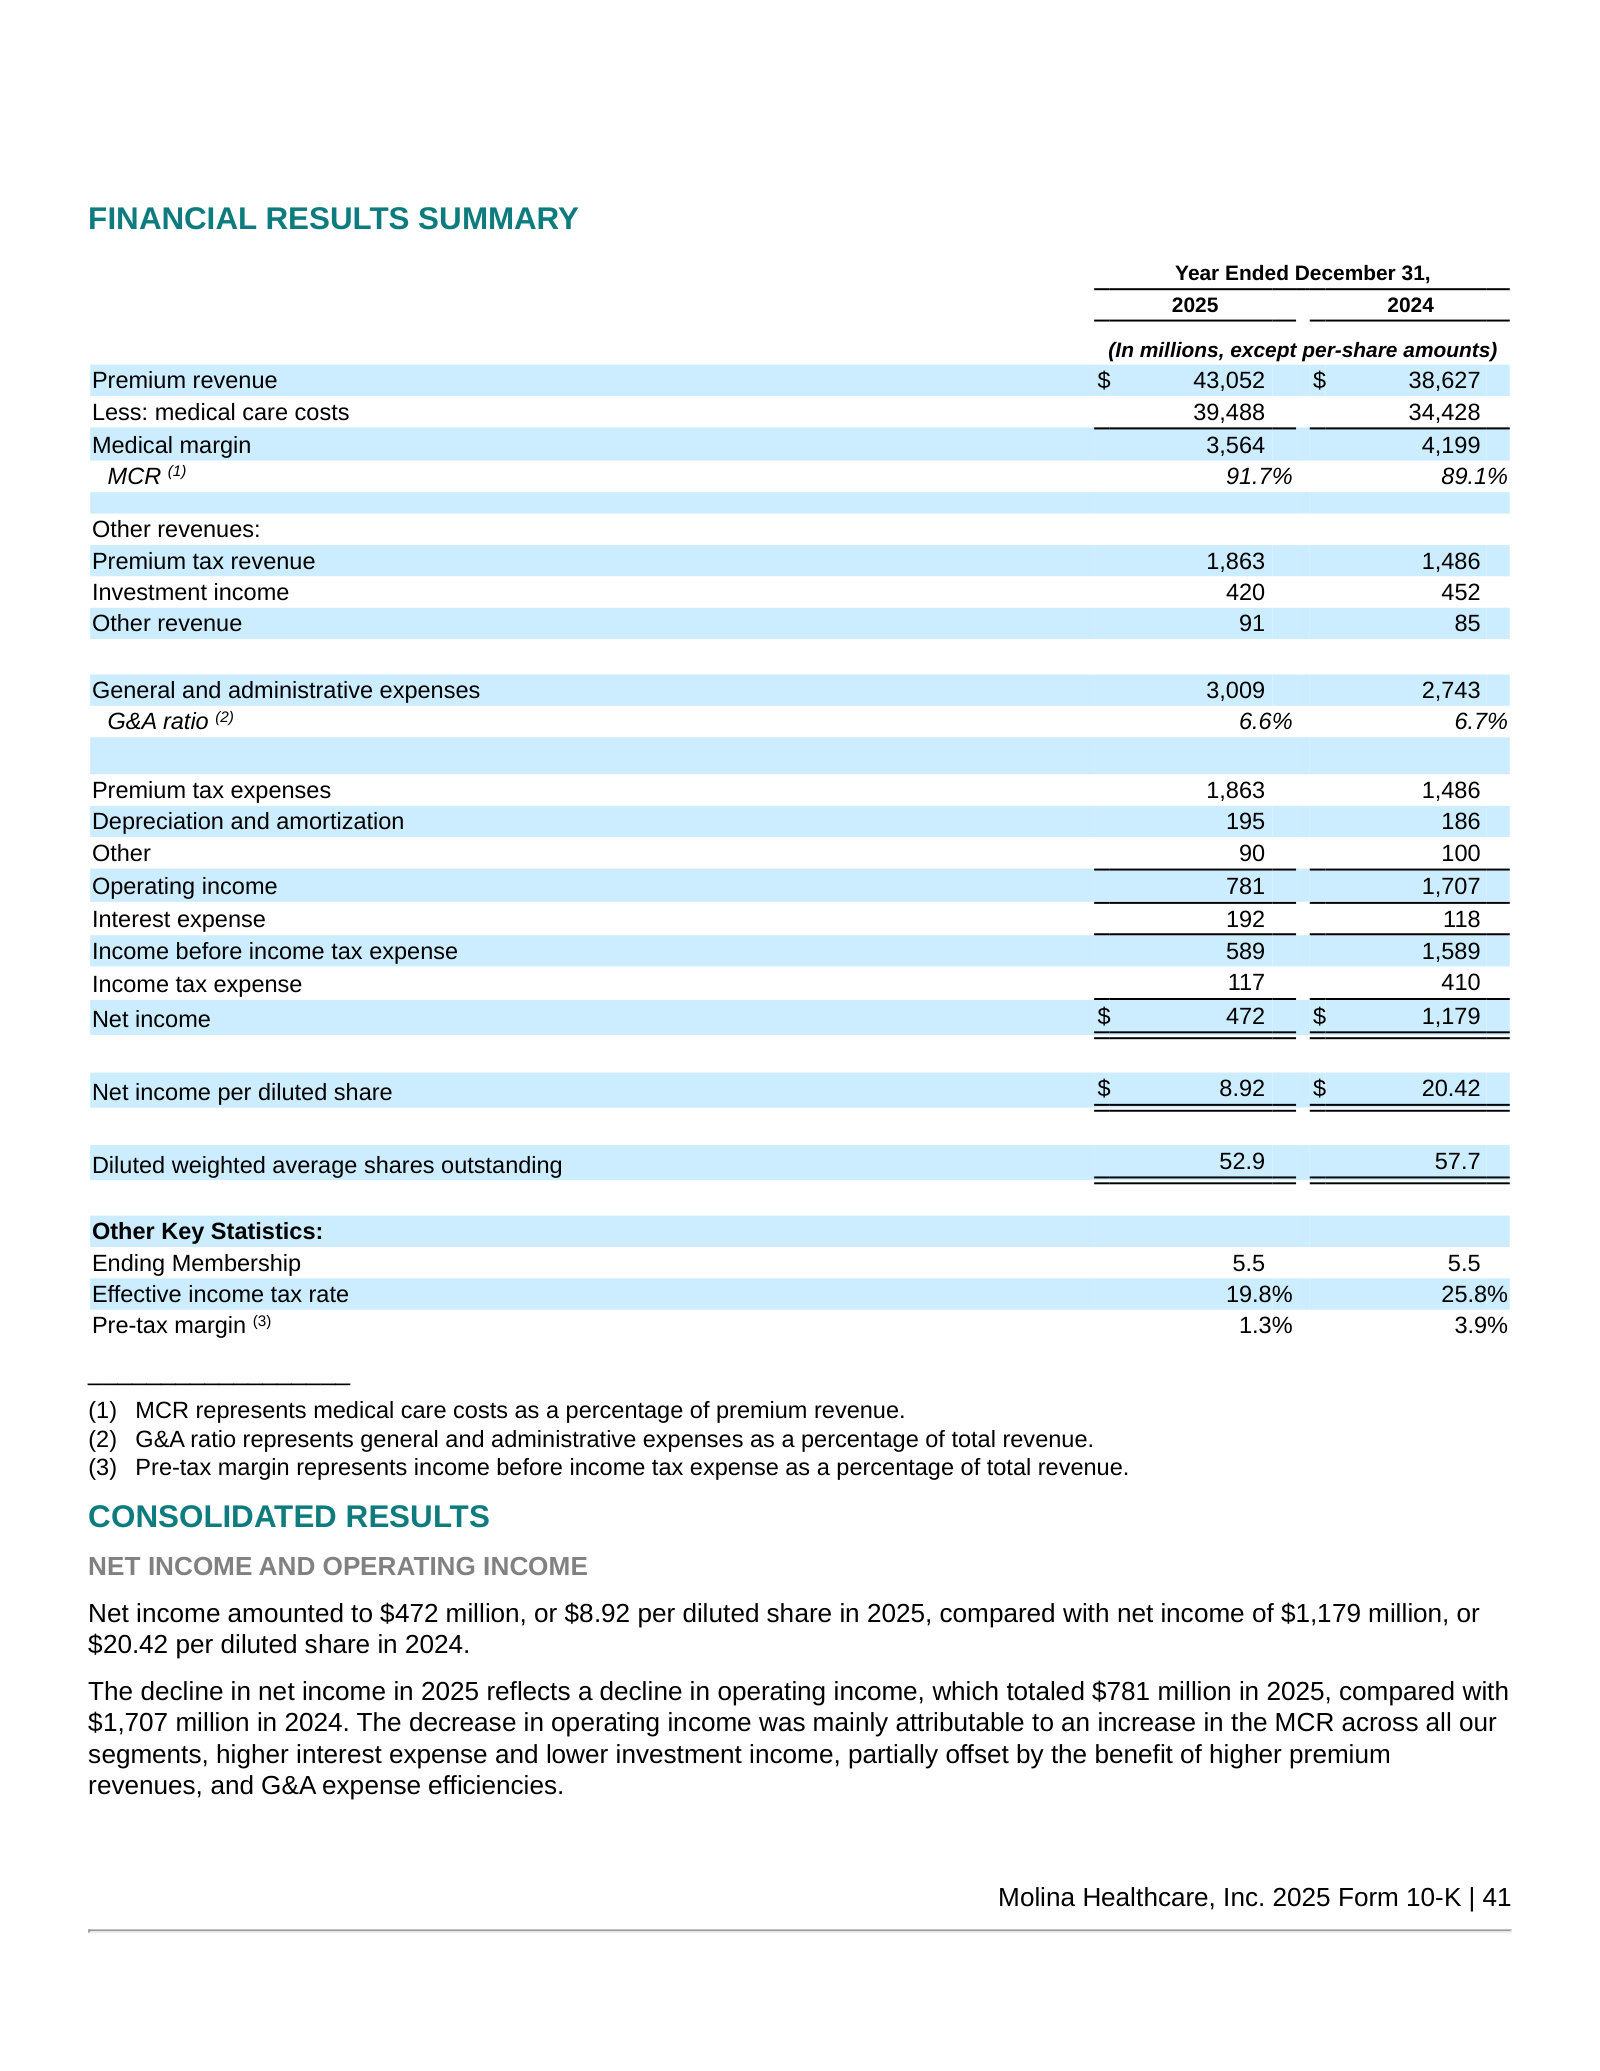
2025 result: net income fell to $472M from $1,179M, driven by a higher MCR across all segments.
Net income amounted to $472 million, or $8.92 per diluted share in 2025, compared with net income of $1,179 million, or $20.42 per diluted share in 2024. […] The decrease in operating income was mainly attributable to an increase in the MCR across all our segments, higher interest expense and lower investment income
p. 78 · Read in context →
Critical Accounting Estimates — p. 92 · Read the full section →
The estimate that defines a managed-care insurer: IBNP, the reserve for claims incurred but not yet paid, and the auditors' critical matter.
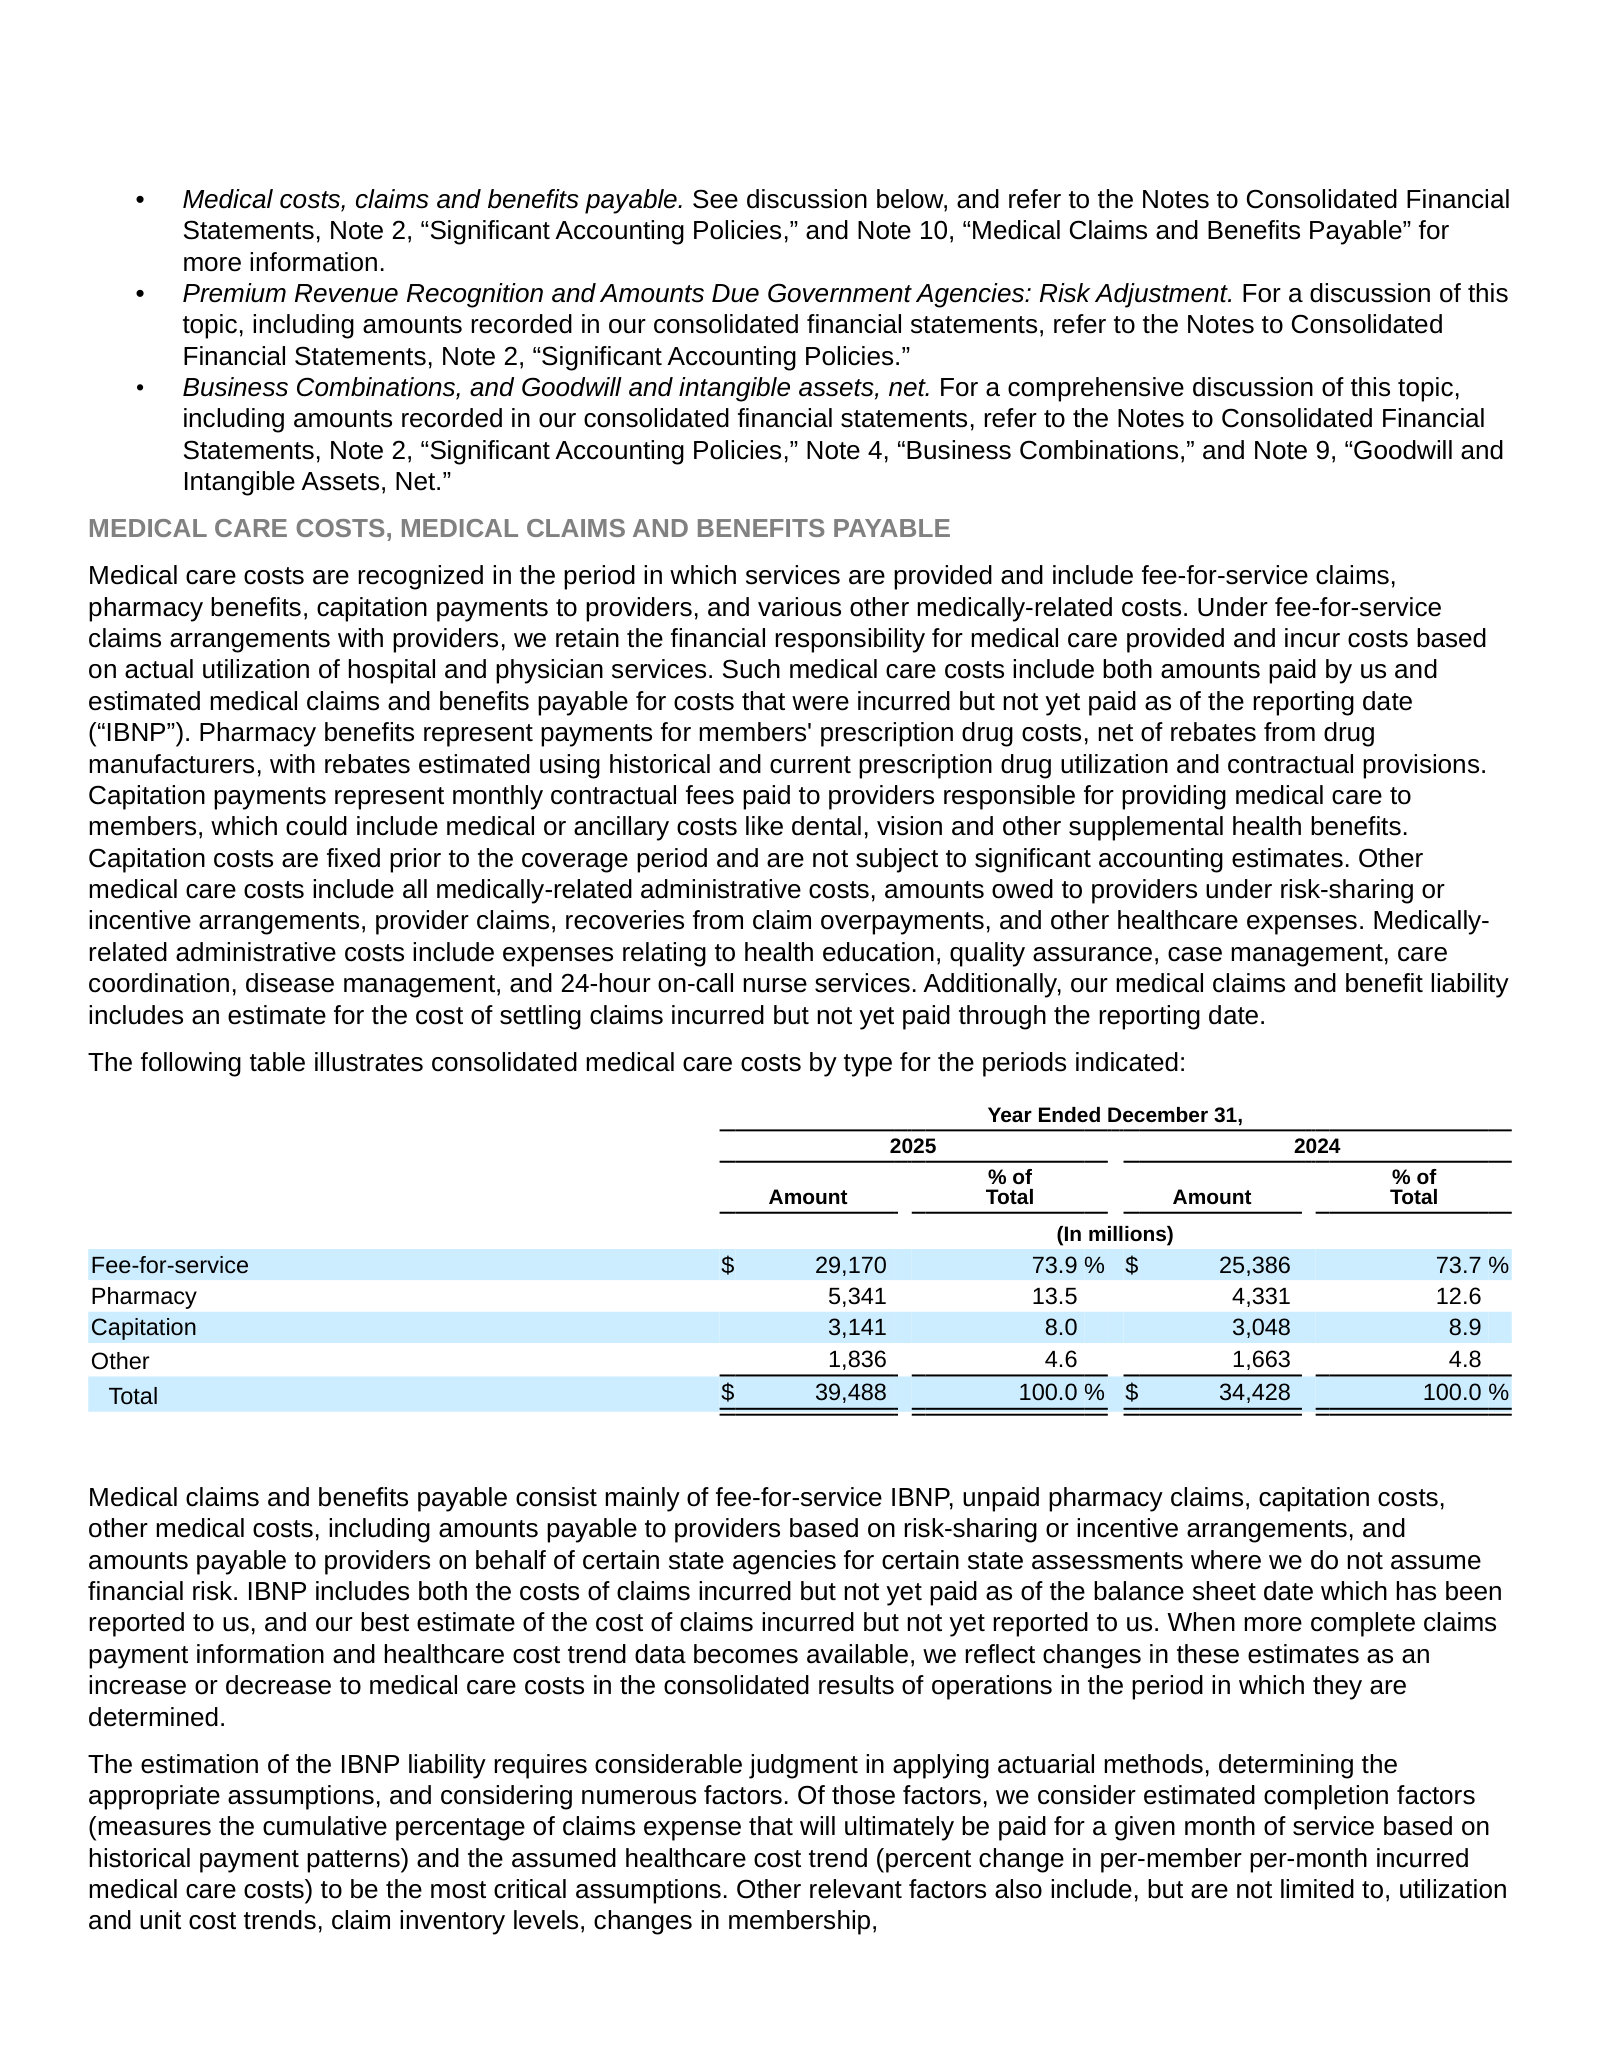
How medical care costs and the IBNP reserve are recognized — the judgment at the heart of every quarter's result.
Medical care costs are recognized in the period in which services are provided and include fee-for-service claims, pharmacy benefits, capitation payments to providers, and various other medically-related costs. Under fee-for-service claims arrangements with providers, we retain the financial responsibility for medical care provided and incur costs based on actual utilization of hospital and physician services. Such medical care costs include both amounts paid by us and estimated medical claims and benefits payable for costs that were incurred but not yet paid as of the reporting date (“IBNP”).
p. 94 · Read in context →
Molina Healthcare, Inc. — FY2021 Annual Report (Form 10-K) — FY2021
Featured for one section: the first 10-K under the four government-program segments Molina still reports today. · Open the full document →
Item 1. Business — Our Segments — p. 7 · Read the full section →
Sees the pivot itself — the Q1 2021 realignment to programs (Medicaid/Medicare/Marketplace/Other) that frames every report since.
The Q1 2021 realignment to Medicaid, Medicare, Marketplace and Other segments — the reporting structure still in use.
In the first quarter of 2021, we realigned our reportable operating segments to reflect recent changes in our internal operating and reporting structure, which is now organized by government program. These reportable segments consist of: 1) Medicaid; 2) Medicare; 3) Marketplace; and 4) Other.
p. 7 · Read in context →
More annual reports
Molina Healthcare, Inc. — FY2024 Annual Report (Form 10-K) — FY2024 · 155 pages · The prior-year peak the FY2025 decline is measured against — full-year results at an 89.1% MCR before margins compressed. · Open →
Molina Healthcare, Inc. — FY2023 Annual Report (Form 10-K) — FY2023 · 151 pages · Covers the post-pandemic Medicaid redetermination wind-down and the Bright Health California Marketplace acquisition. · Open →
Molina Healthcare, Inc. — FY2022 Annual Report (Form 10-K) — FY2022 · 142 pages · First full year under the four-program segments, absorbing the AgeWell, My Choice Wisconsin, Cigna and Affinity acquisitions. · Open →
Source: S&P Capital IQ consensus via Xpressfeed · Generated 2026-07-22.
FY28 normalized EPS estimates nearly halved over 180 days while revenue was trimmed just ~3%
180 days ago FY28 normalized EPS consensus sat near $25; it now reads under $13. The recent 30- and 90-day drift is modestly upward on both years, hinting the cuts have found a floor.
Currency: USD · Scale: money in millions, absolute · Point-in-time consensus; Δ90d is Now versus 90d.
| Metric | FY | 180d | 90d | 30d | Now | Δ90d |
|---|---|---|---|---|---|---|
| EPS (normalized) | FY2027 | $16.34 | $8.54 | $9.26 | $9.29 | +8.8% |
| EPS (normalized) | FY2028 | $25.09 | $12.51 | $12.34 | $12.93 | +3.4% |
| Revenue | FY2027 | $50.37bn | $46.67bn | $47.25bn | $47.52bn | +1.8% |
| Revenue | FY2028 | $52.12bn | $49.16bn | $49.54bn | $50.43bn | +2.6% |
Beat / miss record
Current sequences by metric: Revenue: 1 consecutive miss; EPS (normalized): 1 consecutive beat.
Currency: USD · Scale: money in millions, absolute · Consensus is captured before each actual first became effective.
| Quarter | Metric | Consensus | Actual | Surprise | Outcome |
|---|---|---|---|---|---|
| Q1 FY2026 | Revenue | $10.89bn | $10.80bn | -0.8% | Miss |
| Q1 FY2026 | EPS (normalized) | $1.91 | $2.35 | +23.0% | Beat |
| Q4 FY2025 | Revenue | $10.90bn | $11.38bn | +4.3% | Beat |
| Q4 FY2025 | EPS (normalized) | $0.33 | -$2.75 | -921.5% | Miss |
| Q3 FY2025 | Revenue | $10.98bn | $11.48bn | +4.5% | Beat |
| Q3 FY2025 | EPS (normalized) | $3.89 | $1.84 | -52.7% | Miss |
| Q2 FY2025 | Revenue | $10.94bn | $11.43bn | +4.4% | Beat |
| Q2 FY2025 | EPS (normalized) | $5.53 | $5.48 | -0.9% | Miss |
| Q1 FY2025 | Revenue | $10.81bn | $11.15bn | +3.1% | Beat |
| Q1 FY2025 | EPS (normalized) | $5.96 | $6.08 | +2.1% | Beat |
| Q4 FY2024 | Revenue | $10.32bn | $10.50bn | +1.7% | Beat |
| Q4 FY2024 | EPS (normalized) | $5.88 | $5.05 | -14.2% | Miss |
| Q3 FY2024 | Revenue | $9.91bn | $10.34bn | +4.3% | Beat |
| Q3 FY2024 | EPS (normalized) | $5.94 | $6.01 | +1.1% | Beat |
| Q2 FY2024 | Revenue | $9.75bn | $9.88bn | +1.3% | Beat |
| Q2 FY2024 | EPS (normalized) | $5.68 | $5.86 | +3.2% | Beat |
Forward estimates
Currency: USD · Scale: money in millions, absolute · YoY uses the prior fiscal year from the feed; analyst count and range use the first displayed period.
| Metric | FY2026E | FY2027E | FY2028E | FY2029E | YoY | Analysts | Low / high |
|---|---|---|---|---|---|---|---|
| Revenue | $44.28bn | $47.52bn | $50.43bn | $57.56bn | -2.5% | 15 | $42.25bn / $45.76bn |
| EPS (normalized) | $5.16 | $9.29 | $12.93 | $20.30 | -53.2% | 19 | $4.36 / $5.60 |
| Gross margin | 12.4% | 12.6% | 12.9% | 13.3% | -0.6pt | — | — |
Analysts split nearly four-to-one on FY27 normalized EPS despite full coverage
FY27 normalized EPS spans $3.50 to $13.50 across 19 analysts — wide coverage, little agreement on how fast margins recover. FY28 EPS and FY28 revenue carry similar spreads.
Currency: USD · Scale: money in millions, absolute · Spread/mean is absolute high-low divided by absolute mean.
| Metric | Period | Mean | Low–high | Spread/mean | Analysts |
|---|---|---|---|---|---|
| EPS (normalized) | FY2027E | $9.29 | $3.50–$13.50 | 107.6% | 19 |
| EPS (normalized) | FY2028E | $12.93 | $9.65–$16.70 | 54.5% | 13 |
| Revenue | FY2028E | $50.43bn | $46.50bn–$55.41bn | 17.7% | 10 |
Street snapshot
Fifteen of nineteen analysts rate Molina a hold against just three buys; the $129–$286 target range (mean ~$211) mirrors the split in the forward estimates.
Currency: USD · Scale: money in millions, absolute · Analyst counts shown explicitly.
| Street view | Reading | Analysts |
|---|---|---|
| Recommendation mix | Buy 3, Outperform 0, Hold 15, Underperform 1, Sell 0 | 19 |
| Consensus score | 2.74 | 19 |
| Target price | mean $210.8; median $209.0; high $286.0; low $129.0 | 17 |
FY2029 rests on a handful of analysts — EBITDA on one
FY2029 revenue, normalized EPS and GAAP net income each rest on one to three analysts, and FY2029 EBITDA on a single model. Treat the outer-year tape as indicative, not consensus.
Visible Alpha broker models via S&P Xpressfeed · 14 brokers · 316 line items · freshest revision 2026-07-14.
Broker models frame Molina as a 2026 earnings trough followed by a Medicaid-rate-led recovery. Consolidated premium revenue dips to ~$42.1B in FY-2026 before reaccelerating to ~$46.3B (FY-2027) and ~$50.3B (FY-2028) as Medicaid rates catch up to medical cost. The consolidated medical cost ratio peaks near 92.5% in 2026, and adjusted EBITDA nearly halves to ~$702M before rebuilding. Marketplace has been deliberately shrunk to its most profitable core, while Medicaid PMPM does the heavy lifting on the top line.
Margins bottom in 2026: consolidated MCR peaks near 92.5% before easing to ~91.8%
| Line | FY-2025A | FY-2026E | FY-2027E | FY-2028E | YoY | Brokers |
|---|---|---|---|---|---|---|
| Cost ratio % | — | — | — | — | — | — |
| Medical cost ratio(%) | 91.3% | 92.5% | 92.1% | 91.7% | +1.2pt | 13 |
| Medical cost ratio - Medicaid(%) | 91.5% | 92.8% | 92.6% | 92.3% | +1.3pt | 12 |
| Medical cost ratio - Medicare(%) | 91.4% | 93.8% | 92.5% | 91.9% | +2.4pt | 12 |
| Medical cost ratio - Marketplace(%) | 90.0% | 85.6% | 83.9% | 83.2% | -4.4pt | 12 |
| Profit $M | — | — | — | — | — | — |
| Medical margin | $3.71bn | $3.16bn | $3.66bn | $4.09bn | -14.8% | 13 |
| Adjusted EBITDA | $1.23bn | $704.02m | $1.01bn | $1.33bn | -42.5% | 10 |
Key drivers
| Line | FY-2025A | FY-2026E | FY-2027E | FY-2028E | YoY | Brokers |
|---|---|---|---|---|---|---|
| Premium Revenue - Medicaid | $32.00bn | $33.04bn | $38.03bn | $40.49bn | +3.2% | 13 |
| Premium revenue - Medicare | $6.12bn | $6.43bn | $5.64bn | $6.02bn | +5.0% | 13 |
| Premium Revenue - Marketplace | $4.58bn | $2.67bn | $2.61bn | $2.84bn | -41.7% | 13 |
| Premium revenue | $42.78bn | $42.11bn | $46.04bn | $48.91bn | -1.6% | 14 |
Key drivers
Marketplace shows the opposite: membership more than halves while PMPM climbs from ~$549 to ~$939 — a deliberate mix shift toward margin.
| Line | FY-2025A | FY-2026E | FY-2027E | FY-2028E | YoY | Brokers |
|---|---|---|---|---|---|---|
| Members (M) | — | — | — | — | — | — |
| Average Membership - Medicaid(M#) | 4.74m Number | 4.54m Number | 4.65m Number | 4.77m Number | -4.2% | 12 |
| Average Membership - Marketplace(M#) | 563,525 Number | 437,338 Number | 246,985 Number | 250,464 Number | -22.4% | 12 |
| PMPM ($) | — | — | — | — | — | — |
| Per Member Per Month (PMPM) - Medicaid($) | $574.5 | $606.8 | $673.1 | $710.2 | +5.6% | 12 |
| Per Member Per Month (PMPM) - Marketplace($) | $556.6 | $831.3 | $881.0 | $934.6 | +49.4% | 12 |
Brokers split on the 2027 recovery: Medicaid rate and the EBITDA rebound are most contested
| Line | Period | Median | Q1–Q3 | Min–max | Brokers |
|---|---|---|---|---|---|
| Per Member Per Month (PMPM) - Medicaid($) | FY-2027E | $664.8 | $632.2–$694.6 | $604.1–$794.0 | 12 |
| Average Membership - Medicaid(M#) | FY-2027E | 4.57m Number | 4.47m Number–4.75m Number | 4.38m Number–5.35m Number | 12 |
| Premium revenue | FY-2027E | $46.30bn | $45.28bn–$47.86bn | $41.57bn–$49.06bn | 14 |
| Adjusted EBITDA | FY-2027E | $1.05bn | $1.00bn–$1.10bn | $604.84m–$1.18bn | 10 |
Marketplace: shrunk on purpose into the most profitable book
Models show Marketplace membership more than halving from ~556k (FY-2025) to ~248k (FY-2027) while its medical cost ratio falls from ~90% to ~84% and PMPM rises toward ~$885 — margin chosen over volume.
Coverage is solid on the P&L but thins on forward KPIs
Headline revenue and MCR draw on 11-14 brokers, but adjusted EBITDA and segment KPIs thin to 7-10, and the FY-2027 recovery is genuinely unsettled — operating EPS spans ~$3.50 to ~$13.50.
Headline P&L consensus, momentum and beat/miss live in the CapIQ tab.
Source: S&P Capital IQ transcripts via Xpressfeed · latest indexed call 2026-04-23 · generated 2026-07-22.
Latest call digest
Molina Healthcare, Inc., Q1 2026 Earnings Call, Apr 23, 2026 · 2026-04-23T12:00:00
Q1 2026 call (April 23, 2026). Molina reported adjusted EPS of $2.35 on $10.2 billion of premium revenue and a 91.1% consolidated MCR, and reaffirmed full-year 2026 guidance of approximately $42 billion of premium revenue and at least $5 in adjusted EPS. Management characterized the quarter as solid but against modest expectations, following a 2025 that swung from an initial $24.50 EPS outlook to $11.03 delivered.
The gap between prepared remarks and the Q&A was one of tone rather than fact. Prepared remarks leaned optimistic: Medicaid trend was modestly favorable, the January rate updates came in as expected, the acuity-shift pressure of 2025 did not recur, and the newly converted Medicare duals products were off to a good start. Yet management repeatedly declined to raise guidance, invoking a "time tested" preference for two quarters of data after 2025's volatility. Notably, Q1 Medicaid trend annualized would run below the 5% full-year assumption, but management would not yet call it.
The one guidance change was mechanical: same-store Medicaid attrition was raised from a 2% to a 6% decline (California, Illinois, New York, Texas, with California's undocumented population singled out), offset by higher Marketplace revenue so that the $42 billion premium figure held. Management argued the higher attrition carries no incremental acuity because low- and no-utilizers are at their lowest recorded level. An Investor Day on May 8 was flagged for the 2029 outlook; the $42 billion / $5 baseline will not be updated there.
Participant coverage from the latest call.
| Group | Participants | Count |
|---|---|---|
| Management | Operator; Jeffrey Geyer — Head of Investor Relations, Molina Healthcare, Inc.; Joseph Zubretsky — President, CEO & Director, Molina Healthcare, Inc.; Mark Keim — Senior EVP, CFO & Treasurer, Molina Healthcare, Inc. | 4 |
| Analysts | Andrew Mok — Director, Barclays Bank PLC, Research Division; Stephen Baxter — Senior Equity Analyst, Wells Fargo Securities, LLC, Research Division; Ann Hynes — Managing Director of Americas Research & Senior Healthcare Services Equity Analyst, Mizuho Securities USA LLC, Research Division; Kevin Fischbeck — Managing Director in Equity Research, BofA Securities, Research Division; Justin Lake — MD & Senior Healthcare Services Analyst, Wolfe Research, LLC; Sarah James — Research Analyst, Cantor Fitzgerald & Co., Research Division; Albert Rice — Health Care Services Analyst, UBS Investment Bank, Research Division; Scott Fidel — Research Analyst, Goldman Sachs Group, Inc., Research Division; John Stansel — Analyst, JPMorgan Chase & Co, Research Division; Erin Wilson Wright — Equity Analyst, Morgan Stanley, Research Division; Ryan Langston — Director & Senior Analyst, TD Cowen, Research Division; Hua Ha — Senior Research Analyst, Robert W. Baird & Co. Incorporated, Research Division; Lance Wilkes — Senior Analyst, Bernstein Institutional Services LLC, Research Division; George Hill — MD & Equity Research Analyst, Deutsche Bank AG, Research Division; Jason Cassorla — VP & Equity Research Analyst, Guggenheim Securities, LLC, Research Division | 15 |
Curated latest-call exchanges; one row per analyst topic.
| Analyst | Firm | Topic | What changed in Q&A |
|---|---|---|---|
| Andrew Mok | Barclays | Medicaid attrition drivers | Pressed on which states drive the 2% to 6% attrition step-up and the MLR read-through; management named California, Illinois, New York and Texas and argued no acuity impact. |
| Stephen Baxter | Wells Fargo | Acuity-shift baseline | Challenged whether the low/no-utilizer floor is truly a zero-acuity baseline given tighter enrollment management; deferred a longer view to Investor Day. |
| Kevin Fischbeck | BofA Securities | Reaffirm vs. raise | Asked whether holding guidance is normal Q2 convention or reflects unquantifiable unknowns; management framed it as prudence after 2025's inflection. |
| Justin Lake | Wolfe Research | Quarterly trend and acuity split | Requested quarterly Medicaid trend and the trend-versus-acuity split; management declined quarterly granularity, citing pure-period noise. |
| Scott Fidel | Goldman Sachs | Medicare duals vs. MAPD | Asked to parse continuing duals from the exiting MAPD product; management gave a roughly $5.5 billion, 94% MLR duals run-rate as the 2027 jumping-off point. |
| Michael Ha | Robert W. Baird | Low/no-utilizer definition | Pushed for the MLR buckets defining low utilizers; management declined to disclose the definition, saying the direction is down regardless of definition. |
Theme tracker
Themes are curator-classified across supplied calls.
| Theme | Status | Quarters mentioned | Read-through |
|---|---|---|---|
| Medicaid rate-versus-trend imbalance | persisted | Q3 2024, Q4 2024, Q1 2025, Q2 2025, Q3 2025, Q4 2025, Q1 2026 | The central driver of the earnings reset. Medicaid cost trend was cited at roughly 3% through 2023, doubled to about 6% by Q3 2024 and 7.5% for full-year 2025, outrunning rate updates. Management consistently argues the market is 300-400 basis points underfunded and expects rates to catch up over time. |
| Redetermination acuity shift and low/no-utilizers | persisted | Q2 2023, Q3 2024, Q4 2024, Q1 2025, Q2 2025, Q3 2025, Q4 2025, Q1 2026 | First raised as negligible in 2023, it became a quantified driver (about 250 basis points of 2025 trend) as low utilizers left the rolls. By Q4 2025 and Q1 2026 management argues the effect is largely behind them, using low/no-utilizer levels and stayer/leaver convergence as evidence. |
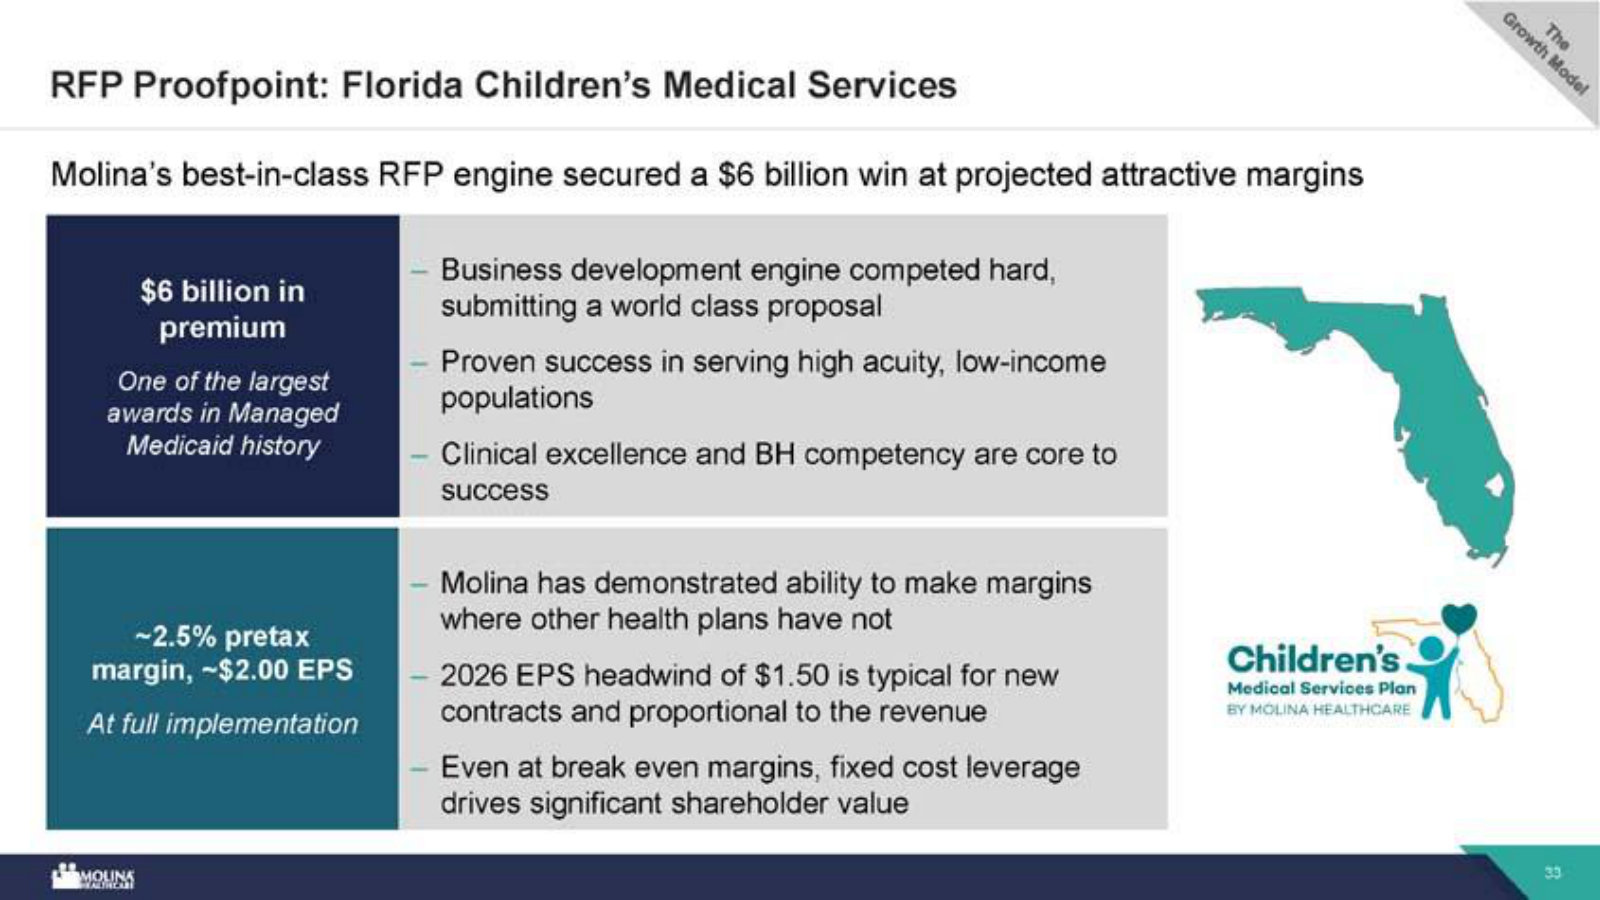
| Embedded earnings framing | persisted | Q2 2023, Q4 2024, Q1 2025, Q2 2025, Q3 2025, Q4 2025, Q1 2026 | A recurring device for future earnings power. The figure rose from $5.50 per share in 2023 to $8.65 through 2025 and above $11 after the Florida CMS win, used to reassure investors through the margin trough. |
| Marketplace exposure reduction | emerged | Q3 2025, Q4 2025, Q1 2026 | After Marketplace drove roughly half of the 2025 shortfall, management shifted from a growth stance to a deliberate roughly 50% premium cut, repricing up about 30% and prioritizing renewals. This reframing of a formerly favored segment is a clear signal of risk appetite. |
| Medicare duals focus and MAPD exit | emerged | Q3 2025, Q4 2025, Q1 2026 | Management narrowed Medicare strategy to dual-eligibles, converting MMP members to integrated FIDE/HIDE products and announcing an exit from traditional MAPD for 2027 (a roughly $1 EPS drag in 2026 that does not recur). |
| Risk-corridor buffer thesis | dropped | Q2 2023, Q2 2024, Q3 2024, Q4 2024, Q1 2025 | For roughly two years management leaned on risk corridors as the first cushion against trend (about 200 basis points of protection). As corridors depleted through 2024 and gave no benefit by Q4 2024, the talking point faded and is essentially absent by Q4 2025 and Q1 2026 – the loss of that downside protection is itself signal. |
Guidance ledger
Quotes, calls, and speakers are source-verified; outcomes are curator-classified.
| Verbatim guidance | Call | Speaker | Curator outcome | Outcome note |
|---|---|---|---|---|
| “Our full year 2025 adjusted earnings per share guidance is now expected to be approximately $14 per share, which is $5 below our prior guidance of $19 per share.” | Molina Healthcare, Inc., Q3 2025 Earnings Call, Oct 23, 2025 · 2025-10-23T12:00:00 | Joseph Zubretsky | missed | Full-year 2025 adjusted EPS was reported at $11.03 on the Q4 2025 call, below this $14 guide and the original $24.50 outlook. |
| “This early view of the 2026 earnings per share baseline should provide for an outlook for 2026, which likely approximates this year's updated full year guidance.” | Molina Healthcare, Inc., Q3 2025 Earnings Call, Oct 23, 2025 · 2025-10-23T12:00:00 | Joseph Zubretsky | missed | This implied a roughly $14 2026 baseline; the Q4 2025 call subsequently guided 2026 to at least $5, far below the preliminary view. |
| “Our 2026 adjusted earnings per share guidance is at least $5.” | Molina Healthcare, Inc., Q4 2025 Earnings Call, Feb 06, 2026 · 2026-02-06T13:00:00 | Joseph Zubretsky | pending | Reaffirmed on the Q1 2026 call after a quarter management described as modestly favorable to expectations. |
| “In Medicaid, 2026 rates are expected to average approximately 4% and will not offset medical cost trend projected at 5%.” | Molina Healthcare, Inc., Q4 2025 Earnings Call, Feb 06, 2026 · 2026-02-06T13:00:00 | Joseph Zubretsky | pending | On the Q1 2026 call management reaffirmed the 4% rate / 5% trend assumption and noted Q1 trend ran modestly favorable, but declined to lower the trend pick. |
| “which we reaffirm at approximately $42 billion of premium revenue and at least $5 in adjusted earnings per share” | Molina Healthcare, Inc., Q1 2026 Earnings Call, Apr 23, 2026 · 2026-04-23T12:00:00 | Joseph Zubretsky | pending | Held despite modestly favorable first-quarter trend; management said it will update after second-quarter results. |
Q&A pressure map
Question counts and firms are curator tallies; analyst coverage shown above.
| Topic | Questions | Firms | Pressure / response |
|---|---|---|---|
| Medicaid attrition and renewed acuity-shift risk | 4 | Barclays, Wells Fargo, Robert W. Baird, Deutsche Bank | The most-pressed topic on the Q1 2026 call. Four analysts probed whether the raised 6% same-store attrition brings a fresh acuity shift; management pointed each time to record-low low/no-utilizer levels and stayer/leaver convergence. |
| Why reaffirm rather than raise guidance | 3 | BofA Securities, Morgan Stanley, UBS | Analysts questioned whether the caution reflected unquantified unknowns after a favorable quarter; management repeatedly cited a 'time tested' preference for two quarters of data and said nothing unusual occurred in Q1. |
| Medicaid cost-trend composition | 2 | Wolfe Research, Bernstein | Requests for quarterly trend and the trend-versus-acuity split. Management addressed the annual picture and pure-period basis but declined the quarterly granularity requested. |
| Low/no-utilizer definition | 2 | Wells Fargo, Robert W. Baird | Analysts sought the specific MLR buckets defining a low utilizer. Management confirmed the direction is down but explicitly declined to disclose the definition or the model, so the definitional detail requested went unanswered. |
Language shifts
Only language evidence verified against the referenced component is shown.
| Observation | Verbatim evidence | Call ID | Component |
|---|---|---|---|
| Tone eased from 2025's 'unprecedented' trend language to guarded, expectations-adjusted optimism. | “We would characterize the results as solid under the circumstances but that characterization is against the backdrop of current modest expectations.” | 1986884066 | 2 |
| New confidence that the redetermination acuity shift will not recur, though still framed as a holding expectation rather than a certainty. | “Our expectation that the acuity shift trend that we had experienced in 2025 was behind us and would not recur is holding up.” | 1986884066 | 2 |
| A new recurring caution phrase, 'time tested,' introduced to justify not extrapolating one favorable quarter. | “We use the term time tested because I think it is prudent to see 6 months of results before updating our guidance, particularly coming off a highly volatile medical cost inflection environment in 2025.” | 1986884066 | 16 |
| On the prior call, management characterized the 2025 trend as an aberration, an assertion that underpins the 2026 recovery thesis. | “We believe the medical cost trend in 2025 was an aberration, an anomaly by historical standards.” | 1975844137 | 2 |
| 'Trough' entered the lexicon as management called the bottom of the Medicaid margin cycle. | “We believe our 2026 forecast for Medicaid is the trough for managed Medicaid margins.” | 1975844137 | 2 |
The call history documents a sharp reset – from a $24.50 initial 2025 EPS outlook to $11.03 delivered and a 2026 floor of at least $5 – around a Medicaid rate/trend gap management insists is cyclical rather than structural. Q1 2026's modestly favorable trend and the deliberate refusal to raise guidance are the first tentative evidence for the trough thesis; the May 8 Investor Day and first-half data are the real tests of whether rates catch up.
Competitors describe Molina Healthcare, Inc.'s market in their own filings and calls. These verified passages and visual pages show where their strategies meet, using source documents preserved in Sources.
Centene (CNC)
Centene is Molina's single most direct competitor: by its own account the nation's largest Medicaid and Marketplace insurer, bidding for the same state Medicaid contracts, ACA exchange members and dual-eligible (D-SNP) populations that anchor Molina's book.
Centene's stated positioning as the nation's largest Medicaid and Marketplace insurer and largest stand-alone PDP provider — 27.6 million members, $194.8B revenue, and a high D-SNP concentration — spanning all three of Molina's government markets.
During 2025, we operated in four segments: Medicaid, Medicare, Commercial and Other. For the year ended December 31, 2025, our Medicaid, Commercial, Medicare and Other segments accounted for 57%, 21%, 19% and 3%, respectively, of our total external revenues. Our membership totaled 27.6 million as of December 31, 2025. For the year ended December 31, 2025, our total revenues were $194.8 billion and our total cash flow from operations was $5.1 billion. Based on the most recent publicly available membership data, we are the nation's largest Medicaid and Marketplace insurer, as well as the largest stand-alone PDP provider. Our Medicare Advantage business includes one of the highest concentrations of D-SNP members among our peers, aligned with our focus on low-income, complex populations.
p. 12 · Read in context →
Centene describes refining its Medicare footprint to overlap its Medicaid presence for D-SNP alignment, ahead of CMS rules requiring integrated dual-eligible care from 2027–2030 — the same Medicaid-to-Duals convergence Molina is pursuing.
Accordingly, we have been refining our Medicare footprint to overlap more closely with our Medicaid presence to provide D-SNP offerings that support alignment and have one of the highest D-SNP concentrations among our peers. CMS regulations will require beneficiaries dually enrolled in Medicare and in a Medicaid managed care plan to receive integrated care through the Medicaid company's Medicare Advantage D-SNPs beginning in 2030, with certain restrictions beginning in 2027.
p. 16 · Read in context →
Centene's CEO on Medicaid competitive dynamics: rate pressure squeezing smaller, nonprofit plans, which it frames as a potential membership-growth opportunity if competitors exit certain geographies.
Sarah London, CEO: Relative to competitive dynamics, we are seeing continued rate pressure having an impact on different markets and certainly some of the smaller, nonprofit plans. And, frankly, this has been an important input into states thinking about making sure that they're funding the programs to be sufficient so that they have a competitive marketplace and that members have the quality of services that they want and they deserve. And I think over time, you know, it's something that we would watch relative to potential membership growth, if competitors choose to exit any of those geographies.
p. 12 · Read in context →
Elevance Health (ELV)
Elevance is a large government-programs rival across Medicaid, Duals and the ACA marketplace. Its management speaks in unusual detail about the same forces driving Molina — Medicaid rate-versus-acuity lag, redetermination-driven morbidity, and the Medicaid-to-Duals convergence. Featured material is limited to its government business, not its commercial or Carelon-services lines.
Elevance's government-benefits head describes its framework for weighing rate adequacy against trend when deciding whether to exit a Medicaid state contract, and the RFP and annual contract-renewal mechanics involved — the same procurement battlefield Molina bids in.
Felicia Norwood, President, Government Health Benefits: if a state isn't going to deliver the expectations that we need from a financial perspective, we will certainly consider exiting that business if we can't deliver on the long term. But our framework has to consider a lot of variables. We have to take a look at the rate adequacy versus the trend that we're seeing, the program designs, the regulatory environment and policy stability that we see there, all kinds of things with respect to our risk-sharing arrangements, operational challenges and other things. […] if we were to exit, Lance, we would align that with normal changes in terms of contract extensions, which, as you know, actually happen every year because Medicaid contracts, while they are 4 or 5-year contracts, the contract renews every single year. And then there's also certainly the opportunity around RFPs in that strategy with respect to exiting.
p. 8 · Read in context →
Elevance's CFO attributes roughly 70% of its elevated ACA cost trend to higher-acuity members moving from Medicaid to the ACA exchange during redetermination — the Medicaid-to-Marketplace migration Molina straddles on both sides.
Mark Kaye, CFO: First, the risk pool's acuity and morbidity have significantly increased due to a higher ratio of healthier members, particularly in states with a larger number of fully subsidized individuals. This change has been driven by market exits and the movement of higher acuity members from Medicaid to ACA during the redetermination process, which accounts for approximately 70% of the total impact.
p. 3 · Read in context →
Elevance describes Duals as a long-standing strategy aligned to its Medicaid footprint and complex-care management — the same convergence of Medicaid and dual-eligible members that is central to Molina's growth.
Felicia Norwood, President, Government Health Benefits: Duals has been a strategy for us for some time. It aligns very well with our Medicaid footprint and also the ability of Carelon to help manage individuals who have complex conditions. So we invested in HMO and duals in order to make sure that we were continuing to focus on those areas that we believe drive great value for seniors and meaningful value for the enterprise.
p. 12 · Read in context →
UnitedHealth Group (UNH)
UnitedHealth is the largest US health insurer; its UnitedHealthcare Community & State segment is a top-scale Medicaid competitor (32 states, ~7.4M members), and it overlaps Molina in Duals/D-SNP and the ACA exchange. Featured material is limited to the government-programs business, not Optum or commercial.
UnitedHealth's Medicaid (Community & State) footprint — 32 states and DC, nearly 7.4 million members, 1.2 million via ACA expansion — and its description of how states award managed-care plans through a formal bid process.
As of December 31, 2025, UnitedHealthcare Community & State participated in programs in 32 states and the District of Columbia, and served nearly 7.4 million people; including 1.2 million people through Medicaid expansion programs in 19 states under the Patient Protection and Affordable Care Act (ACA). States using managed care services for Medicaid beneficiaries select health plans by using a formal bid process or by awarding individual contracts.
p. 10 · Read in context →
UnitedHealth's insurance-unit CEO on Medicaid funding lagging member acuity into 2026, with 2026 draft rates received on nearly half of its January-cycle contracts — the rate-adequacy dynamic at the center of Molina's Medicaid margin story.
Tim Noel, CEO of UnitedHealthcare: In Medicaid, the path to recovery will be more challenging. States have not funded in line with actual cost trends. So funding levels are not sufficient to cover the health needs of state enrollees. While we're making steady progress in bridging this gap with states, the mismatch between rate adequacy and member acuity will likely extend through 2026. To date, we have received 2026 draft rates on almost half of our contracts, which have a January 1 rate cycle, and we continue to advocate for rate updates to better reflect our ongoing experience with elevated trends.
p. 3 · Read in context →
UnitedHealth's stated plan to approach the ACA individual exchange far more conservatively for 2026 — potentially exiting select markets — as subsidy expiration is expected to cut membership and raise morbidity, the same policy cliff facing Molina's Marketplace book.
Tim Noel, CEO of UnitedHealthcare: The individual exchange business, while we are prepared to continue to participate, the majority of the thirty markets we currently serve. We will approach them far more conservatively for 2026. We may need to make the difficult decision to exit select markets if we are unable to achieve the rates necessary for higher market-wide morbidity. Additionally, due to the projected expiration of premium subsidies across the ACA market, our membership should decline significantly. And we are mindful of the potential for adverse selection dynamics as we reprice these offerings for next year.
p. 3 · Read in context →
CVS Health (Aetna) (CVS)
CVS Health's Aetna competes with Molina in Medicaid, Duals and — until its 2026 exit — the ACA individual exchange. Its decision to leave the exchange, which Molina is expanding into, and its Medicaid rate commentary sit directly on Molina's turf. Featured material excludes CVS's pharmacy/retail and Caremark businesses.
Aetna's government-medical footprint as described in CVS's 10-K: Medicaid/CHIP services in 15 states and a fully coordinated dual-eligible (Duals) offering — the Medicaid and Duals lines that overlap Molina.
Medicaid and CHIP: The Company offers health care management services to individuals eligible for Medicaid and CHIP under multi-year contracts with government agencies in various states that are subject to annual appropriations. CHIP are state-subsidized insurance programs that provide benefits for families with uninsured children. The Company offered these services on an Insured or ASC basis in 15 states in 2025. Duals: The Company provides health coverage to beneficiaries who are dually eligible for both Medicare and Medicaid coverage. These members must meet certain income and resource requirements in order to qualify for this coverage. The Company coordinates 100% of the care for these members and may provide them with additional services in order to manage their health care costs.
p. 8 · Read in context →
Aetna's benefits president on Medicaid rate advocacy and a high-trend 2026 environment, saying it remains cautious while working with states on adequate rates — the same rate-versus-trend balance Molina manages.
Steve Nelson, President, Health Care Benefits (Aetna): Look, the Medicaid business has been performing in line with our expectations. We had a really strong year of rate advocacy execution in 2025, and we're going to continue that focus and discipline there. As we enter 2026, again, I think we're off to a strong execution start. It's obviously a high trend environment. We remain cautious and prudent as we think about this, but the trends that we're seeing are in line with what we've laid out in our expectations. We're going to continue to work really closely with our state partners to make sure we have adequate rates while also providing clinical and operational excellence.
p. 10 · Read in context →
CVS frames its exit from the ACA individual exchange as a 2026 tailwind — the opposite of Molina's Marketplace expansion — while taking a cautious Medicaid outlook amid industry-wide pressure.
Brian Newman, CFO: With our Health Care Benefits business, we expect another year of meaningful margin improvement at Aetna. This includes another year of progress in our Medicare Advantage business, supported by our disciplined approach to plan design and footprint in individual as well as repricing opportunities in our group business. We also expect a tailwind from our exit of the individual exchange business. Although our conversations with our Medicaid state partners continue to progress and this business has performed in line with our expectations this year, we are taking a cautious outlook in light of the broader pressures across the industry.
p. 5 · Read in context →
Humana (HUM)
Humana is Medicare-Advantage-centric but is expanding state Medicaid contracts specifically to build integrated dual-eligible (D-SNP) plans — the highest-overlap segment with Molina's Duals franchise — making its Medicaid-procurement strategy a direct competitive read-across.
Humana's insurance-segment head says it views its Medicaid business 'through the lens of duals,' claiming a leading Medicaid-procurement success rate by targeting areas with strong dual-eligible overlap — the same integrated-Duals prize Molina pursues.
George Renaudin, President, Insurance Segment: Regarding the dual opportunity, we view our Medicaid business through the lens of duals, particularly as we consider the changes planned for dual integration states. We have seen a leading success rate in Medicaid procurements by focusing on areas with strong connections to the dual opportunity. The rationale for this is that duals generally provide higher margins compared to traditional or Medicare Advantage businesses. We have observed that these dual products perform well financially right from the first year, in contrast to some core products that take longer to yield benefits. We're actively experiencing this trend and have secured several Medicaid contracts, which will enhance our dual market presence in key areas.
p. 10 · Read in context →
Humana's CEO on its Medicaid expansion to 10 states (plus three awarded), noting its book skews to non-expansion states and LTSS populations that it expects to be less exposed to federal Medicaid cuts than Medicaid broadly.
Jim Rechtin, President and CEO: Strategic expansion of Medicaid continues with the launch of the Virginia contract, this brings our active footprint to 10 states with 3 more states awarded in pending. I know there's been a lot of curiosity about the impact of the Big Beautiful Bill. Our footprint in Medicaid is largely in non-expansion states, and it tends to be skewed towards the LTSS or long-term support services population. These geographies in this population are less impacted by the bill. So while the bill will certainly have some impact, we expect it to be more muted for us versus Medicaid broadly. We remain committed to our Medicaid strategy and the assumptions we made at Investor Day about margin progression.
p. 2 · Read in context →
Humana distinguishes its own Medicaid book from a competitor's troubled Florida exposure, pointing to differences in product mix, state footprint and value-based network structure.
George Renaudin, President, Insurance Segment: I think that one of our competitors did acknowledge that their Florida problem was really specific to a population that we don't have exposure to. So again, you have to think about product first, you have to think about the state footprints. And then the third part that is really important to think about with Medicaid is the network structure.
p. 4 · Read in context →
More peer documents
Q2_FY2025 — 14 pages · Centene's CEO details its Medicaid rate-adequacy playbook (88% of the franchise re-rated between 7/1/25 and 1/1/26, ~5% composite rate) and its Ambetter Marketplace repricing across 29 states. · Open →
CNC_annual_report_FY2024 — 170 pages · Prior-year 10-K with Centene's FY2024 Medicaid scale (~13.0M members, 30 states) — a baseline for the redetermination-driven Medicaid membership decline into FY2025. · Open →
ELV_annual_report_FY2025 — 230 pages · Lists Elevance's Medicaid states one by one and its Medicaid membership (~8.5M, down from 10.5M in 2023) — overlay against Molina's footprint to map head-to-head state competition. · Open →
Q4_FY2025 — 4 pages · Elevance's 2026 line-of-business outlook: Medicaid cost trend at roughly twice the historical average and a Medicare mix tilting toward D-SNP. · Open →
Q4_FY2025 — 13 pages · UnitedHealth quantifies expected 2026 Medicaid/D-SNP membership contraction of ~565,000–715,000 from reduced eligibility plus a one-state exit, with 6–7% aggregate rate increases. · Open →
Q2_FY2025 — 12 pages · Aetna on Medicaid rate advocacy and higher-acuity cases, plus the individual-exchange (IFP) premium deficiency reserve and orderly wind-down ahead of its 2026 exit. · Open →
HUM_annual_report_FY2025 — 153 pages · Humana's 10-K Medicaid state list and D-SNP/Medicaid-linkage description, with ~$14.5B state-based revenue and ~1.6M members — the structural driver pushing Humana into Molina's Medicaid markets. · Open →
Q4_FY2025 — 14 pages · Humana quantifies D-SNP growth of ~140,000 new members (~18%) and discusses how much of that came from competitors exiting counties — a direct read on dual-eligible share shifts. · Open →
Fit
Does not fit the framework (P1 not met); contested: P2
Molina clears the universe screen and trips none of the exclusions, but the year-10 durability gate (P1) does not clear — and by the framework's own construction that gate decides fit whatever the other pillars show. Confidence is high: two model families agreed, the trial was order-stable, and load-bearing spreads were at most 0.15. No exclusion hits, no watchlist-only flag, no prior-driven risk; one pillar, P2, is contested.
Universe and exclusions
Here is the decisive framing point: nothing here softens the screen, and nothing here disqualifies Molina either. It is a US company incorporated in Delaware, common stock listed directly on the NYSE under MOH — not an ADR, not a Chinese issuer [1]. Market capitalization is roughly $11.9 billion (52.9M shares at the 2026-07-16 close of $224.82), above the $10 billion floor — but by only about 19%, and at the February 2026 trough of $122.65 the same share count implied about $6.5 billion, below the line. The screen is met on today's price, not settled.
The exclusion list is clean, each item checked against the record rather than waved through:
- Auto OEM / capital-cycle car maker — not triggered. Molina is a government-sponsored managed-care insurer, sector Health Care [2].
- Structural decline — not triggered. Revenue has not fallen for three consecutive years; the only declines were FY2018 and FY2019, reversed, with revenue rising every year since to $45.4 billion.
- Consensus-saturated darling — not triggered. The stock trades at ~0.26x sales, is down 66% peak-to-trough, is a consensus Hold, and forward EPS has been cut ~53%. This is the opposite of a bottom-left-to-top-right chart.
- China dependence — not raised. Operations span 21 US states; essentially all premium is US Medicaid, Medicare and Marketplace [3].
- Promotional CEO without skin in the game — not triggered, with a genuine caveat in the same breath: the long-tenured CEO (since November 2017) delivered acquisitions and buybacks as promised, but missed initial full-year EPS guidance two years running (FY2024 $22.65 vs at-least-$23.50; FY2025 $11.03 vs at-least-$24.50), and insider ownership is low at 1.44% [4]. Credibility is dented; the exclusion still does not trip.
Pattern match
This is the framework's third setup — a healthcare/insurance forecasting error — but only in part. The forecasting-error half fits the template: an insurer misjudged cost trend, took four dated 2025 guidance cuts, and the market repriced the stock; premiums reset on an actuarial calendar, and Medicaid reprices roughly 60% of revenue each January against a cost base management puts about 20% above three years ago [5]. The 2026 Medicaid MCR guide of 92.9% embeds 4% rate increases against 5% trend, with a roughly $2.50-per-share embedded-earnings drag set to reverse in 2027 [6].
The part that does not fit the template: about half the original revision is a Marketplace withdrawal, not a forecasting miss. Membership is being cut roughly two-thirds and about $2.3 billion of premium pulled as enhanced ACA subsidies expire at the end of 2025 [7]. A clean Centene-style repricing case would have the whole industry reprice and mean-revert; here, one large driver is a structural exit rather than a timing error, which is why the diagnosis below leans the way it does.
Pillar ledger
Year-10 durability gate (P1) — not met
This is the gate, and it is where fit is decided. The disqualifier is not tripped: revenue grew from $17.8 billion (FY2016) to $45.4 billion (FY2025), zero consecutive declining years [8]. Market structure and entry barriers support conviction on the revenue leg: government managed care has consolidated to a handful of national plans — Centene, CVS Health, Elevance, UnitedHealth, Humana [9] — down from a field of 500-plus Medicaid contractors two decades ago [10], and entry is gated by state certificates of authority, provider networks, competitively bid contracts, and significant statutory capital [11].
What the gate demands — very-high conviction on both revenue AND free cash flow ten years out — is not available. Revenue is re-competed on 3-5 year state contracts rather than owned; the government counterparty is legislating a Medicaid contraction (OBBBA: a 15-20% Expansion enrollment cut by 2029, plus provider-tax and payment limits phasing in from 2028 over 5-15 years with "uncertain" impact) across the gate's own window [12]; and the FCF leg is volatile — reported FCF was negative in two of the last ten years — and not measurable on the framework's adjusted basis. The gate is binary and fails on any proper doubt; the doubt is real. The strongest surviving counter-fact sits in the same treatment: the OBBBA Expansion cut is only about 4-5% of the 4.57M Medicaid base, and revenue has more than doubled across the decade — so the gate fails on conviction, not on evidence that revenue is set to shrink. The full treatment is on the Durability tab. The vote was unanimous (a/b/c/d all not-met), spread 0.06.
FCF consistency (P2) — contested
Rolling five-year average reported FCF has stayed positive and range-bound ($614M-$1,334M) across the decade despite two negative single years (FY2018, FY2025), which fall about seven years apart — the 5-8 year cadence the framework treats as inherent to insurers [13]. On that evidence the consistency test is met. The counter-fact in the same breath: the framework's own preferred series — rolling five-year ADJUSTED FCF, net of stock-based compensation and trailing acquisitions — is not_computable from the feature file, so the two Claude jurors read "met" while the two Codex jurors returned cannot-determine. That is the split recorded below; the Yield tab carries the FCF series.
Dislocation and yield (P3) — dislocation met, yield short of the bar
The dislocation is genuine and severe: a 66% fall from a $360.77 peak (2024-09-16) to a $122.65 trough (2026-02-11), triggered by four dated 2025 cuts to full-year adjusted EPS guidance ($24.50 → $22 → $19 → $14, actual $11.03) [14]. The fear gauge fires: traded volume spiked to 5.57x the pre-peak median, clustered on the cut dates, with a single ~10.3M-share session (~25x normal) on the Q4 loss day. P3a and P3b are met, each on a survived claim; the Dislocation tab carries the anatomy.
The yield is where the entry trigger falls short. Molina reads as a net-cash, fortress-class balance sheet — long-term debt $3.77B against $4.25B of cash [15] — which selects the 8-9% reference bar. On current and trailing adjusted FCF the yield is far below any bar (negative to ~5.5%); only on a normalized/consensus basis does it reach ~8.1%, at the floor of the fortress bar and about 190 bps short of the 10% default bar (P3c, not met). Consensus forward FCF does clear the 10% bar raw (~10.6% three-year average) and the fortress bar after adjustment (~8.1%), which is why the forward-path criterion (P3d) is met, spread 0.04 — but the reconciling fact is that most of the "real" yield lives in a consensus recovery, not in trailing cash. The Yield tab shows the full computation.
Balance sheet and self-help (P4) — able and willing, with one qualifier
Molina can comfortably outlast a one-to-two-year cost problem: no senior note matures before 2028, the $1.25B revolver is undrawn to 2030, debt-to-capital is ~48% against a 60% covenant, and FY2025 operating income covered interest ~4.1x [16] (P4a met). The repurchase engine is executed, not just authorized — $1.0B of buybacks in each of 2024 and 2025, share count cut 8.3% in one year (57.7M to 52.9M), $500M of live authorization — so the share count is falling and the SBC/serial-acquisition hard-fail does not apply [17] (P4b met). Dividend cover is not applicable — Molina pays no common dividend (P4c).
The counter-fact carried in the same treatment: the ~$8.3B of consolidated cash overstates buyback capacity because most of it is regulated statutory capital at the plans; only $223M sat at the unregulated parent at year-end, and the real fuel is the ~$985M annual upstream dividend flow [18]. Management ranks repurchases third behind organic growth and distressed-plan acquisitions, which compete for the same ~$1.5B annual flow [19]. The Self-Help tab carries the maturity schedule and buyback record.
Diagnosis (P5) — leans permanent, uncontested
The profile's adversarial trial rules the probability the impairment is temporary at 0.37 — a lean toward permanent, with the ruling uncontested (per-judge 0.37 / 0.29 / 0.38; spread 0.09). The best-case framework setup is a short-term earnings fall the market anchors to; here the news plausibly impairs intrinsic value by an amount closer to what the price did, because roughly half the revision is a structural Marketplace exit rather than a timing miss. P5 is not met, spread 0.09. The counter-fact in the same breath: the Medicaid driver has a genuine self-correcting repricing mechanism (about 60% of revenue reprices each January), so a materially better 2027 rate cycle would move the ruling. The Damage Math tab presents both cases and the ruling.
Instrument context (I1) — options exist, but the read is not verifiable
Long-dated listed options exist: LEAPS expiring 2027-01-15 and 2028-01-21 (the latter ~18 months out), with the liquidity typical of a large-cap index constituent. Current 30-day implied volatility is 63.86% (dated 2026-07-21), in the elevated 60-70 reference band rather than the up-to-~50-55 acceptable range, and inflated by the 2026-07-22 earnings print the options are positioned around. Because per-strike liquidity and a settled, non-event IV level could not be pinned to a citable source, the tally marks I1 not-verifiable — but the watchlist-only case (no qualifying long-dated options) does not apply, since the options are there. The Clock tab carries the expression-context line.
What a 3x would require
The framework's target test — the price at bar-yield on normalized adjusted FCF, and what consensus would have to concede — cannot be rendered as the profile's re-rating arithmetic: the tally records the re-rating math as unavailable because the applicable bar or normalized adjusted FCF is missing (adjusted FCF is not_computable where stock-based compensation is absent from the feed). What can be shown is the intrinsic-value band the trial and consensus imply, against the current price and the February trough.
Value scenarios derived from consensus normalized EPS discounted at a back-solved ~9.8% rate, probability-weighted by the trial's p_temporary of 0.37; current price ($224.82, 2026-07-16) and February trough ($122.65) from the profile's deterministic feature file.
At the February trough the gap between price damage and plausible value damage was wide; at $224.82 the price sits inside the probability-weighted band of roughly $217-$265, so the obvious mispricing that existed at $122.65 has largely closed. On this name's own base rate a full round-trip to the prior $360-$420 highs is a two-year-plus process: the one comparable mature-era episode (the 2015-2018 ACA scare, -47.6%) took about 29 months to round-trip, and the partial recovery already in hand (+83% off the trough in about five months) has run faster than that base rate. The Clock tab carries the episode history.
Contested and undetermined
One pillar is contested: P2, FCF consistency. The vote split is met / met / cannot-determine / cannot-determine — the two Claude jurors read the rolling reported-FCF series as stable and met, while the two Codex jurors could not resolve it on the framework's adjusted basis. The named missing datapoint on the cannot-determine side is a Complete rolling 5-year adjusted FCF stability series, including SBC and acquisition adjustments. — equivalently, a rolling 5-year adjusted FCF stability series with SBC and trailing acquisition adjustments — which the feature file returns not_computable. No other criterion is contested, and none was left as an overall cannot-determine verdict.
Provenance
Source: fit_tally.json provenance block and refutations.json (the profile's deterministic tally and skeptic ledger).
The verdict was pressed hard: two independent model families scored the checklist blind to the reader's framework, the trial was rerun with the two briefs in reversed order and moved only 0.035, and a name-masked seat reproduced the same gate result — so the P1 failure is not an artifact of one model, one ordering, or knowing the ticker. Of 41 claims the skeptic checked, none were refuted; six were weakened but survived, and one (the implied-vol read) is unverifiable.
Falsifier ledger
These are the standing conditions that would change the read — thresholds, directions, and windows carried forward from the tally. Adjusted FCF or EBITDA sliding where flat-or-better was underwritten is the framework's own core falsifier; the name-specific conditions follow.
Data gaps
What the run could not answer, carried from the tally:
- Adjusted FCF and its stability series are
not_computable: stock-based compensation is absent from the financial feed for every year, and acquisitions defaulted to zero. All adjusted figures here are reconstructed from the filed 10-K cash-flow statements, not from the deterministic feature, and a complete rolling 5-year adjusted FCF series with SBC and trailing acquisition adjustments could not be assembled. balance_sheet_classreturnedunknown(EBITDA absent from the income feed); the net-cash / fortress classification was computed here from the filed balance sheet.- The 2027 Medicaid rate-cycle outcome — whether states fully fund the ~20%-higher cost base — is unknown; the clock's central mechanism can only be tracked forward against dated catalysts.
- Q2 FY2026 results and the reset full-year guidance (2026-07-22) post-date the corpus, so the candidate re-rating quarter's outcome is not yet in evidence.
- Current market cap could not be pinned to a single dated source around the 2026-07-22 print; the verdict uses the 2026-07-16 feature-file close per the profile contract.
- Official short interest is unavailable (FINRA returned no position rows), so seller composition relies on insider Form 4s and index membership only.
- Per-strike option liquidity and a settled, non-event implied-vol level were not verifiable; only the LEAPS listings and the earnings-inflated 63.86% spot IV were confirmed.
- The capitulation gauge anchors the peak at the 2024-09-16 local high ($360.77); shares traded higher ($419.53) in March 2024, so the full retracement from the all-time high is deeper than the gauge's -66%.
- No national Medicaid managed-care market-share table is in the corpus; market structure is evidenced by named competitors and relative revenue scale.
- No pre-2016 revenue/FCF history is indexed to test durability across the 30-50 year window despite the 1980 founding.
Business
Molina Healthcare is a US-listed (NYSE: MOH) government-sponsored managed-care insurer — Medicaid, Medicare duals, and ACA Marketplace — serving roughly 5.5 million members across 21 states on $45.4 billion of FY2025 revenue, founded in 1980. Its ~$11.9 billion market cap clears the framework's $10 billion floor, if by a slim margin. The industry is a consolidated oligopoly of a handful of national plans sitting behind state licensing and statutory-capital barriers. It is no auto-OEM, carries no China exposure, and — down two-thirds from its 2024 peak with a Hold-rated tape — screens as an out-of-favour name, not a consensus darling.
What Molina does
Molina Healthcare, a FORTUNE 500 company, sells managed healthcare under government programs: Medicaid, Medicare, and the state insurance marketplaces. It was founded in 1980 as a provider organization serving low-income families in Southern California and reincorporated in Delaware in 2002; it served approximately 5.5 million members across 21 states as of December 31, 2025 [1]. The model is simple to state: state and federal agencies pay Molina a fixed per-member premium to take on the medical risk of a defined population, and Molina profits when the care it arranges costs less than the premium it collects. Essentially all of its revenue is premium from those government contracts — $43.05 billion of the $45.43 billion FY2025 total [2].
In two sentences: Molina is a pure-play government-managed-care company that rents its balance sheet and provider networks to states and to CMS, insuring people who qualify for Medicaid, dual-eligible Medicare, and subsidized exchange coverage. It earns a thin spread on a very large premium base — net margin was roughly 1% in FY2025 — so results are governed by one ratio, the share of each premium dollar spent on medical care.
Total Revenue (FY2025)
Members
Market Cap
Employees
Sources: FY2025 Form 10-K, Item 1 Business [3] and Human Capital [4]; market cap from fit_features (52.9M shares x $224.82 close, 2026-07-16).
Segments and their economics
Molina reports four segments — Medicaid, Medicare, Marketplace, and an insignificant Other — all but the last representing government-funded programs [5]. Medicaid is the core: three-quarters of premium and 83% of members. Medicare skews to higher-acuity dual-eligible members, and Marketplace grew sharply in 2025 on pricing strategy and the ConnectiCare acquisition.
Source: FY2025 Form 10-K — segment membership and premium revenue [6]; medical margin and MCR by segment [7].
The "medical care ratio" (MCR) — medical costs as a percentage of premium — is the whole game. Across the book it ran 91.7% in FY2025, up 260 basis points from 89.1% the year before, and it rose in every segment: Medicaid 90.3% to 91.8%, Medicare 89.1% to 92.4%, and Marketplace from 75.4% to 90.6% [8]. Because the residual margin is so thin, that move compressed total medical margin from $4.20 billion to $3.56 billion and roughly halved earnings. Management attributes it to medical cost trend outrunning the rates states have granted, a "rate and trend imbalance that we believe to be temporary" [9]. Whether that imbalance is temporary or a permanent reset in the economics is the question the Damage Math and Dislocation tabs carry.
Scale and trajectory
Revenue has compounded from $16.8 billion in FY2019 to $45.4 billion in FY2025 — contract wins, redetermination-era Marketplace inflows, and acquisitions (ConnectiCare, closed February 2025). Earnings tell a different, more recent story: net income of $472 million in FY2025 against $1,179 million in FY2024, and diluted EPS of $8.92 against $20.42 [10].
Source: reported financials, FY2019–FY2025 Form 10-Ks; FY2025 figures per Item 1 Business — Financial Highlights [11].
Geographically the footprint is entirely domestic — 21 US states, from Washington and California to Texas, Florida, New York, and New England — with no foreign operations and no revenue outside US government programs [12]. The workforce numbered approximately 19,000 at year-end 2025 [13].
Market structure
The framework's durability gate leans on market structure, so it is worth laying the evidence out plainly. US managed care is an oligopoly of large national plans, and Molina competes against the same short list across its lines. In Medicaid, its 10-K names its "primary competitors" as Centene Corporation, CVS Health Corporation, Elevance Health, UnitedHealth Group, and large not-for-profit organizations, and flags "increasing competition driven by renewed interest from large national health plans" [14]. In Medicare it lists CVS Health, Humana, and UnitedHealth as the large competitors; in Marketplace, its "primary competitor for low-income Marketplace membership is Centene Corporation" [15]. This is not a fragmented cottage industry; it is a handful of scaled players bidding for the same state contracts.
Molina is the smallest of the publicly traded national managed-care organizations by revenue, a specialist among diversified giants. That relative size cuts both ways for durability: it is a genuine top-tier Medicaid operator, but it lacks the pharmacy, provider, and commercial diversification of the larger names.
Source: reported FY2025 revenue per each company's latest annual report / data feed; CVS Health (Aetna), also a named competitor, is omitted for a clean revenue comparison but exceeds Molina many times over. Named peer set per Molina FY2025 Form 10-K [16].
Entry barriers, capital intensity, and how long it has run
Three structural features do the durability work here, and each is documented.
Regulatory entry barriers. A new entrant cannot simply undercut on price. To operate, a plan must obtain a state certificate of authority, build a provider network, stand up claims systems, and — critically — win a competitively bid state contract; states award those contracts on network, quality of service, care-management capability, member satisfaction, reputation, and financial resources, and even an incumbent is not guaranteed a renewal at rebid [17]. Molina's own filing calls the start-up cost of a new health plan "substantial," itemizing the certificate of authority, provider network, infrastructure, and "significant capital to fund mandated net worth requirements, performance bonds or escrows, or contingency guaranties" [18].
Capital intensity as a moat. Each health-plan subsidiary is licensed by a state insurance department (or, in California, the Department of Managed Health Care) and must hold a minimum amount of statutory capital fixed by statute or regulation, with restrictions on paying that capital up to the parent [19]. The regulated subsidiaries paid $985 million of dividends up to the parent in 2025, and the parent contributed $439 million of capital back down — the machinery of a regulated-capital business, not a capital-light one [20].
A long operating history and an essential product. Molina has run health plans for 45 years, since 1980 [21], and the product — health coverage for low-income and dual-eligible populations — is about as non-discretionary as spending gets, delivered under multi-year government contracts.
The structure has hardened over time. At its 2003 IPO, Molina described the Medicaid managed-care industry as "highly fragmented," citing CMS data of "over 500 Medicaid managed care contractors nationwide" as of mid-2001 [22]. Twenty-two years later the same company names five or six national plans as its principal competitors — evidence of consolidation into an oligopoly, the raw material the Durability tab weighs.
Universe screen
Geography (U1). Molina is a US company incorporated in Delaware, with common stock listed directly on the New York Stock Exchange under ticker MOH — not an ADR, not a Chinese issuer [23]. The geography screen is a clean pass.
Market capitalization (U2). On the feature file's snapshot — 52.9 million shares at the $224.82 close of 2026-07-16 — market cap is $11.89 billion, above the $10 billion line but by only about 19%. The proximity is real and worth stating: the stock is one bad print from the floor. At its February 2026 trough of $122.65 the same share count implies a cap near $6.5 billion, well below the threshold, and current sell-side coverage (as of late June / mid-July 2026) rates the shares a consensus Hold with an average price target around $190–211, roughly at or below the current price — a neutral tape, not an excited one. The screen is met on today's price, but it is a live consideration rather than a settled one.
Source: market cap derived from fit_features (shares x close); peak $360.77 (2024-09-16) and trough $122.65 (2026-02-11) from the price series; the $10B line is the framework's universe floor. Listing facts per FY2025 annual report cover [24].
First-pass exclusion screen
Auto-OEM (X1). Not applicable. Molina is a government-sponsored managed-care insurer; it manufactures nothing and has no automotive exposure. The exclusion does not fire.
Consensus-saturated darling (X4). This is the opposite of a darling. On $45.4 billion of revenue and an $11.9 billion cap the shares trade at roughly 0.26x sales — the razor-thin-margin multiple of an insurer, not the multiple-to-sales of a story stock. The chart shape is a two-thirds drawdown (down 66% from the September 2024 peak to the February 2026 trough), the sell side rates it Hold (of the last polled coverage, 3 buy / 15 hold / 1 strong-sell) with the price already at or above the average target, and consensus forward EPS has been cut hard — the FY2026 estimate near $5.16 against $11.03 a year earlier. Nothing here resembles a consensus-owned, extreme-multiple darling; the exclusion does not fire.
China dependence (S1). Absent. Molina's revenue is entirely US government-program premium across 21 US states, with no foreign operations and no China revenue or asset exposure to quantify [25]. The sensitivity flag is not raised.
Dislocation
Molina fell 66% from a September 2024 peak of $360.77 to a February 2026 trough of $122.65, a 513-day, multi-leg decline. The cause is identifiable and dated: four 2025 cuts to full-year adjusted EPS guidance — $24.50 to roughly $10.65 — driven by medical-cost inflation across Medicaid, Medicare and the ACA Marketplace. Volume spiked to 5.57x its pre-peak median. Revenue never faltered; margin did.
The drawdown, quantified
Peak (2024-09-16)
Trough (2026-02-11)
Current (2026-07-16)
Peak-to-trough
Days peak to trough
Recovery off trough
Source: derived from daily price data; drawdown figures per the deterministic capitulation gauge (fit_features.capitulation_gauge.drawdown).
Source: daily market data, as reported; peak/trough anchors per fit_features.capitulation_gauge.
The fall runs in two distinct phases. From the September 2024 peak of $360.77 the stock drifted to about $306 by July 1, 2025 — a 15% slide over nine and a half months, on ordinary volume and with no single dated event. That is drift, not the moment. The moment began on July 2, 2025, when the shares dropped 22% in one session, and the capitulation from there to the February 2026 trough was roughly 60%. (Molina traded higher still — $419.53 — in March 2024; the gauge anchors the capitulation leg at the September-2024 local peak.)
The triggers — four dated guidance cuts
Every leg of the capitulation lines up with a dated document lowering full-year 2025 adjusted EPS. Revenue beat consensus in each of those quarters; the cuts were about medical costs.
Sources: Q2 FY2025 earnings call [1]; Q3 FY2025 call [2]; Q4 FY2025 call [3]; Q1 FY2026 call [4]; price and volume from daily market data.
The single largest one-day fall, July 2, 2025 (down 22%), was not Molina-specific news but sector contagion: Centene withdrew its own 2025 guidance the prior evening, and the managed-care group repriced together [5]. Molina supplied its own trigger five days later, on July 7, 2025, pre-announcing preliminary Q2 results and cutting FY2025 EPS guidance to a $21.50–$22.50 range. At the formal Q2 call on July 24, management cut again, to "no less than $19 per share… which is $5.50 below our initial guidance of $24.50 and $3 lower than the midpoint of what was recently communicated on July 7" [6].
The mechanism is a medical-cost trend that outran the rates Molina is paid. Management called it plainly: "The magnitude and persistence of these medical cost increases are unprecedented" [7]. The third cut arrived with Q3 on October 23, 2025 — full-year adjusted EPS "now expected to be approximately $14 per share, which is $5 below our prior guidance of $19" [8] — as the Marketplace medical care ratio hit 95.6%, meaning the segment paid out 95.6 cents of medical claims on every premium dollar [9]. The year ended below even that: a Q4 "adjusted loss per share of $2.75" reported February 5, 2026 [10], pinning the trough on February 11 at $122.65. The strain is visible in the audited full year: the Medicaid MCR "increased 150 basis points to 91.8% in 2025, compared to 90.3% in 2024" [11].
Source: Q2 FY2025 call (initial $24.50, July 7 midpoint, $19 floor) [12]; Q3 FY2025 call ($14) [13]; FY25 actual is the sum of reported quarterly adjusted EPS ($6.08 + $5.48 + $1.84 − $2.75).
The fear gauge
The capitulation gauge measures the heaviest 20-day average volume in the peak-to-trough leg against the median daily volume of the 180 days before the peak. That ratio is 5.57x (fit_features.capitulation_gauge.volume_spike). The heaviest sustained volume came early, in the July 2025 leg — the first guidance shock, not the final one — while the single heaviest session was February 6, 2026, at 10.3 million shares against a pre-peak median near 0.41 million, roughly 25x a normal day. Volume of that size, clustered on the guidance-cut dates rather than spread through the drift, is the signature of emotion-driven selling rather than orderly repricing.
Who was selling
The seller identity is only partly observable. Official reported short interest is unavailable for this run — FINRA returned no position rows — so short-interest level and change cannot be quantified here. What the records do show argues against forced or informed insider distribution:
Insider Form 4 activity through the fall is grants and tax-withholding, not open-market selling. The one open-market insider sale on file, the Chief Legal Officer's 17,811 shares at $186.12 (about $3.3 million), came on May 11, 2026 — during the recovery, well above the trough, not into the decline. Molina remained in the S&P 500 across the drawdown, so there was no index-deletion forced selling. The most economical reading of the tape is broad institutional repricing coincident with the whole managed-care group, which cut guidance in the same window (Centene, UnitedHealth, Elevance), rather than a single identifiable forced seller.
Estimates versus price
This is where the framework's usual signature is absent. A dislocation worth acting on often shows price falling faster than estimates — fear compressing the multiple on largely unchanged numbers. Molina is the opposite case: revenue estimates barely moved while earnings estimates collapsed in step with the guidance, and price tracked the earnings down rather than outrunning it.
Source: CapIQ consensus momentum snapshots (fit_features.consensus_forward_yield context, data/sp/estimates.json); price from daily market data.
Consensus FY2027 revenue held in a $47–50 billion band throughout; demand for Molina's government-program business was never the question. FY2027 adjusted EPS, by contrast, was nearly halved — from $16.34 in January 2026 to $8.54 by April — across the same window that carried the February trough. Measured peak-to-trough, price fell 66% while initial FY2025 EPS guidance fell 57% ($24.50 to a $10.65 actual); the de-rating largely tracked a real, dated earnings reset, not a multiple compressed by fear alone.
The overshoot evidence sits at the low, not in the down-leg: the trough was set by a 25% single-day capitulation on the Q4 loss, and the stock has since recovered 83% — to $224.82 from $122.65 — while forward EPS estimates barely recovered (FY2027 from $8.54 to $9.29). The re-rating off the bottom outran the estimate change, which is where fear, rather than fundamentals, did the extra work. Whether the earnings reset is temporary or permanent — and what it does to value — belongs to the Damage Math, not here. This tab establishes only what happened: a genuine, severe, dated dislocation whose down-leg was earnings-driven and whose trough carried the marks of capitulation.
Damage Math
Molina's adjusted EPS fell from a $24.50 FY2025 guide to $11.03 actual, and FY2026 is guided to at least $5.00 [1] [2]. The stock fell 66% to its February 2026 trough and sits 38% below its peak. A transparent two-scenario NPV puts plausible value destruction at 18% if the hit is temporary and 52% if it is permanent. The gap that opened at the trough has largely closed at today's $224.82; the trial puts the probability the damage is temporary at 0.37.
The near-term hit — the numerator
The damage began as a series of guidance cuts, not a revenue miss. In April 2025 management reaffirmed full-year 2025 adjusted EPS of "at least $24.50 per share, representing 8% growth over the full year 2024" [3]. The year closed at $11.03 of adjusted EPS and $8.92 GAAP — a 55% shortfall to that guide and a 51% decline from 2024's $22.65 [4]. Reported net income fell from $1,179 million to $472 million [5].
The 2026 guide extends the reset rather than reversing it: adjusted EPS of "at least $5.00 per diluted share," itself burdened by $2.50 of identified drags: $1.50 from implementing the new Florida CMS Medicaid contract and $1.00 from the Medicare (MAPD) product [6]. Consensus agrees: FY2026 normalized EPS sits at $5.16 across 19 analysts (CapIQ, data/sp/estimates.json).
FY25 adj EPS guide (Apr-25)
FY25 adj EPS actual
FY26 adj EPS guide (≥)
FY26 consensus EPS
Source: FY2025 guide and 2026 guide, Molina earnings releases [7] [8]; consensus per CapIQ estimates (data/sp/estimates.json, vintage 2026-07-22).
The revision reached the out-years too, which matters because those years stand in for normalized earning power rather than the trough. Over the six months to July 2026, consensus FY2027 normalized EPS was cut from $16.34 to $9.29, and FY2028 from $25.09 to $12.93 — the latter a 48% cut to a year far enough out that it should already be past the rate-trend imbalance.
Source: CapIQ estimate momentum, 180-day vintage vs current (data/sp/estimates.json, momentum block; as_of 2026-01-23 and 2026-07-22).
One line held throughout: revenue. Premium revenue grew to $43,052 million from $38,627 million, up 11.5% [9], total revenue reached $45.4 billion, and consensus has FY2026 roughly flat at $44.3 billion (data/sp/estimates.json). The impairment is entirely a margin event, which the Dislocation anatomy dates to four 2025 guidance cuts and which frames the whole question here: is a margin that compressed a rate-reset away, or a level that has moved.
The price move over the same window
Against a roughly 55%–80% cut to near-term earnings, the equity fell less at its worst and much less today. From the September 2024 peak of $360.77, the shares bottomed at $122.65 in February 2026 (−66%) and have since rallied 83% to $224.82, leaving them 38% below the peak.
Peak (2024-09-16)
Trough (2026-02-11)
Current (2026-07-16)
Source: daily price series; drawdown per the deterministic capitulation gauge (fit_features.capitulation_gauge.drawdown).
The contrast is the heart of the tab. Near-term (FY2026) consensus EPS is down roughly 80% from the pre-event ~$26 trajectory; the market cap is down 38% from peak, to $11.9 billion on 52.9 million shares. On enterprise value the move is similar — the balance sheet barely changed, with long-term debt rising from $2.9 billion to $3.8 billion and cash-plus-short-term-investments of $8.3 billion, much of it regulated at the health-plan subsidiaries and so not free buyback fuel [10]. This is the reverse of the Centene pattern Ruchir hunts, where the stock fell about one-for-one with the earnings cut and anchored to the trough. Here the market discounted a recovery from the outset: at $224.82 it pays 44x depressed 2026 consensus EPS but only 11x the $20.30 that consensus models for 2029.
The NPV arithmetic, two scenarios
Adjusted EPS is the cleaner owner-earnings proxy for this business than free cash flow: Molina pays no dividend, returns cash through buybacks, and its reported FCF swings on Medicaid working capital — a $535 million operating-cash outflow in 2025 against a $644 million inflow in 2024 [11]. The deterministic adjusted-FCF feature is not_computable here for want of a clean stock-comp series, so no adjusted-FCF yield is carried (see Yield); the model below is built on earnings.
The assumptions are stated so the result recomputes from the page:
- Owner earnings = adjusted EPS.
- Discount rate r = 9.8%, back-solved from the market's own pre-event pricing: $360.77 peak = $24.50 / (r − g) at g = 3%, so r = 24.50/360.77 + 0.03.
- Terminal growth g = 3%; capitalization rate (r − g) = 6.8%.
- Pre-event normalized earning power = $24.50 (the April-2025 FY2025 guide, equal to the 2029 investor-day target of $25).
- Transition years 2026–2028 use current consensus normalized EPS: $5.16 / $9.29 / $12.93.
The baseline, no-impairment value computes to $24.50 / 0.068 = $360/share, which ties to the observed peak — the model is anchored, not free-floating.
Temporary (V-shaped). Earnings sit at consensus through 2028, then earning power is fully restored to $24.50 from 2029, growing 3%. Discounted transition (4.70 + 7.71 + 9.77) = $22.2; terminal ($24.50/0.068 = $360, at end-2028) discounted = $272. Value ≈ $294/share, an 18% haircut to baseline — the cost of the earnings you forgo while recovering, even if nothing is permanently lost.
Permanent (level shift). Earning power resets to a lower plateau. A mild reset holds the plateau at the $20.30 consensus 2029 level: $22.2 + ($20.30/0.068 discounted) = $248/share, a 31% haircut. A harsher reset plateaus at $13 from 2028, with no recovery beyond the near-trough: $171/share, a 52% haircut.
Source: derived DCF-lite; discount rate 9.8% back-solved from the 2024-09-16 peak of $360.77 at g = 3%; transition-year EPS from CapIQ consensus (data/sp/estimates.json).
Now set the price damage beside the value damage. At the February trough of $122.65, the price had destroyed $238/share against the peak — more than even the harsh-permanent read destroys ($189). That is the dislocation: the price overshot the worst defensible value case by roughly $49, and the temporary case by roughly $172. At today's $224.82, the price has destroyed $136/share, which corresponds to a permanent plateau of about $16–18 of earning power — between the mild and harsh permanent scenarios.
Source: derived — price damage vs the $360.77 peak; NPV damage from the two-scenario model above (data/sp/estimates.json; fit_features.capitulation_gauge).
Probability-weighting closes the loop. At the trial's 0.37 weight on temporary, intrinsic value works out to between $217 (0.37 × $294 + 0.63 × $171) and $265 (0.37 × $294 + 0.63 × $248). The current $224.82 sits inside that band; the trough of $122.65 sat far below it. The gap Ruchir hunts was wide at the February trough and has largely closed after the 83% rally — at $225 the market is paying roughly what a permanent-leaning outcome is worth. A higher discount rate would narrow the gap further, not widen it: at r = 11%, the baseline falls to about $306 and the temporary value to about $255, so the temporary case loses its margin of safety fastest. The full snap-back to $24.50 in the temporary scenario is itself generous to the bull, and even on that generous input the price is no longer materially below value.
The trial — temporary or permanent, tried fairly
Whether the impairment is temporary or permanent was decided not here but by the profile's adversarial trial: two opposing, corpus-cited briefs, ruled on by three blind judges. Both cases carry real evidence.
The case for temporary. The 2025 cut is a rate-versus-trend timing gap on a repricing calendar, plus a Marketplace book of about 10% of revenue being deliberately shrunk to breakeven. Of the original $10.50 revision from $24.50, management attributes half to Marketplace and one-third to the Medicaid rate/trend imbalance [12]. The mechanism is quantified and asymmetric: every 100 bps of Medicaid rate improvement adds roughly $4.50 to EPS, 60% of revenue reprices each January at rates management projects "modestly in excess of trend," and second-half-2025 Medicaid already annualizes to a $6.50 "jumping off point" for 2026 [13]. Management counts $8.65 of "embedded earnings" waiting to be harvested and frames the episode as "inclement weather rather than climate change… temporary rather than permanent" [14].
The case for permanent. The damage survived multiple repricing windows and shows up in every segment. Consolidated MCR rose to 91.7% from 89.1%, with Marketplace blowing out to 90.6% from 75.4% and its medical margin falling to $423 million from $617 million despite premium nearly doubling [15]. The remedy for Marketplace is withdrawal, not recovery: membership is guided to 220,000 at year-end 2026 from 655,000 at the end of 2025 [16], with premium down $2.3 billion [17]. Medicare is exiting MAPD with a $93 million impairment [18]. And Q4 carried about $2.00/share of unfavorable retroactive California Medicaid adjustments — the exact delayed-and-retroactive state-pricing risk the model runs on [19]. The bull's own destination concedes the point: the 2029 target of $25 EPS is only April-2025's $24.50 reached four years late, and its bridge leans on future revenue (+$4.25), projected initiatives (+$1.50) and M and A (+$1.00) rather than the existing book simply healing [20].
The ruling. The judges put the probability the impairment is temporary at 0.37 — a lean toward permanent — with individual reads of 0.37, 0.29 and 0.38 (range 0.29–0.38, spread 0.09), and the result was not contested. Reading order barely moved it: judges who read the temporary brief first averaged 0.37, those who read permanent first 0.335, a 0.035 gap. This diagnosis is the report's, and this tab does not override it — the arithmetic above is what the diagnosis is applied to, not a competing verdict.
Panel p(temporary)
Source: profile adversarial trial ruling (ruchir/trial/tally.json); panel p_temporary = 0.37.
Which line broke, and whether it self-corrects
Two drivers account for almost all of the hit, and they carry opposite recovery profiles. Marketplace caused about half the original revision, and its correction is structural subtraction: management is cutting membership by two-thirds and pulling $2.3 billion of premium, so the loss is being removed from the P and L rather than repaired — a smaller, breakeven book, not the old growing one [21]. The enhanced ACA subsidies underpinning that book expire at the end of 2025, which is why the retreat is deliberate rather than cyclical.
The Medicaid piece — roughly one-third of the revision — is the part with a genuine self-correcting mechanism. Medicaid is priced in annual state-set per-member premiums that reset against a continuously moving cost trend; in 2025 locked rates lagged utilization, pushing the Medicaid MCR to 91.8% [22]. With 60% of revenue repricing each January and rates management expects modestly above trend, this is the driver that can mean-revert within 12–18 months — the Clock on which re-recognition depends. The risk that keeps the ruling tilted toward permanent is that the reset has already been tested across several windows and the retroactive-recoupment exposure (California, $2.00/share) is a recurring feature of the rate-taker model, not a one-off. What would move the diagnosis toward temporary is concrete and dated: FY2026 adjusted EPS landing well above the $5 guide with consolidated MCR below 90.5%, and January-2027 Medicaid rates exceeding trend by at least 150 bps with pretax margin back above 3%.
Source: FY2025 Form 10-K, segment MCR and medical margin table [23].
The bottom line for this tab is arithmetic, not a verdict on the stock: the near-term earnings hit was large (roughly 55%–80%), the price hit was smaller and front-loaded, and a conservative NPV destroys 18% of value if the impairment is temporary and 52% if permanent. At the February trough the price fell more than any of those cases justified — a real gap. After an 83% rally, at $224.82 the price sits inside the probability-weighted value band, and the trial's 0.37 reading leaves that value tilted toward the permanent end. The dislocation was there; most of it has been paid back.
Yield
On the framework's adjusted-FCF basis, Molina's yield is not a clean number: FY2025 reported free cash flow was negative (−$636M), so current-year adjusted FCF is roughly −$854M and the spot yield is meaningless. The case rests on normalization. Consensus forward FCF averages ~$1.26B over FY2026–FY2028 — about 10.6% of today's $11.9B market cap raw, and ~8% after the framework's SBC and acquisition haircut. That sits at the bottom of the 8–9% fortress bar (Molina carries net cash) and roughly 190 bps under the 10% default bar.
The deterministic feature file could not compute adjusted FCF (stock-based compensation is absent from the structured feed, and acquisitions were defaulted to zero — false for a serial acquirer like Molina). Every figure below is reconstructed directly from the filed cash-flow statements and cited to the page; the gap is recorded in the ledger.
The adjustment, line by line
The framework's yield basis is adjusted FCF = reported FCF − stock-based compensation − the trailing 5-year average of acquisition spend. Molina's own cash-flow statements supply all three lines. Stock-based comp is modest ($47M–$116M). Acquisitions are not: "Net cash paid in business combinations" ran from $3M to $755M a year as Molina bought Medicaid and Marketplace books (Magellan Complete Care in 2020, ConnectiCare for $350M in 2025 [1]), so the 5-year-average acquisition line is the material part of the haircut.
Adjusted FCF = reported FCF − SBC − trailing 5-yr average acquisitions; shown only for FY2023–FY2025, where a full five-year acquisition window (FY2019 onward) is sourced. Derived from company filings. Sources: FY2025 10-K, Consolidated Statements of Cash Flows [2]; FY2022 10-K [3]; FY2021 10-K [4].
The 5-year-average acquisition line, terminal year inclusive: FY2023 uses FY2019–FY2023 — $(0+755+129+134+3)/5 = $204M; FY2024 uses FY2020–FY2024 — $273M; FY2025 uses FY2021–FY2025 — $171M. So FY2025 adjusted FCF is −636 − 47 − 171 = −$854M, and FY2023 — the last clean year — is 1,578 − 115 − 204 = $1,259M. The adjustment removes roughly $220M–$390M a year; on Molina it is the acquisition average, not SBC, that does the work.
The reported line is worth seeing plainly, because it is what makes single-year yield unusable here.
Reported FCF = operating cash flow − capex. Source: FY2019–FY2025 10-Ks, Consolidated Statements of Cash Flows [5].
Free cash flow swung from +$2.0B (FY2021) to −$636M (FY2025) with no comparable swing in the underlying business — net income stayed positive at $472M even in FY2025 [6]. The swing is working capital: in FY2025, "amounts due government agencies" alone consumed $591M, with receivables and medical-claims payable another ~$277M [7]. For a government-payer insurer, a single year's FCF is a timing artifact, not the earning power.
The yield, three ways
Because current-year FCF is negative, the three framework cuts all read low, and each is stated on today's $11.9B market cap ($224.82 × 52.9M shares, 16 July 2026).
Adjusted FCF ÷ market cap of $11.9B. Current = −$854M; trailing 3-yr avg = $187M (FY2023–FY2025 adjusted, averaged); through-cycle = $652M (FY2020–FY2025 reported-FCF average $1,006M − avg SBC $85M − avg acquisitions $268M). Derived from company filings [8].
The current-year cut is negative (−7.2%). The trailing three-year average is 1.6% — that window happens to capture the entire deterioration, since FY2024 was already weak and FY2025 turned negative. The fairest own-history figure is the six-year through-cycle average adjusted FCF of about $652M, which is 5.5% on today's price.
On the fortress "jump" signature — a stable low yield that suddenly vaults toward the bar — Molina shows a muted version. That same $652M of through-cycle adjusted FCF was about 3.1% at the September 2024 peak ($360.77 on ~57.7M shares, ~$20.8B market cap) and is 5.5% now: the 66% drawdown (Dislocation) roughly doubled the yield. But it is a partial jump, not the Microsoft-style 4%→9% snap, because the numerator collapsed at the same time the price did.
Which bar applies
The balance-sheet class selects the reference line. The deterministic feature returned unknown (it needs an EBITDA field the income feed does not carry), so the computation is done here from the filed balance sheet.
At FY2025 year-end, long-term debt was $3,766M against cash and equivalents of $4,248M and a further $4,008M of short-term investments [9]. Net debt is therefore −$482M against cash alone, and −$4.5B including short-term investments — a net-cash position. Consensus net-debt estimates confirm it and see it deepening: −$0.8B (FY2025) widening to −$2.5B (FY2028). EBITDA (operating income $781M + depreciation and amortization $195M ≈ $976M in FY2025) is positive, so net-debt/EBITDA is negative. By the framework rule (net debt ≤ 0 → fortress), Molina is fortress, and the applicable line is 8–9%.
One honest qualifier: an insurer's cash and investments are largely regulatory capital held at licensed subsidiaries, not freely deployable like a tech balance sheet's net cash. On a stricter reading Molina behaves like a moderate balance sheet, which selects the 10% default bar. The name sits short of both:
Normalized adjusted FCF yield ≈ 8.1% — at the floor of the 8–9% fortress bar, and about 190 bps short of the 10% default bar.
The 8.1% is the normalized figure derived next; on trailing figures the gap is far wider.
Normalized mid-cycle yield
Molina is not a commodity cyclical, but it is mid-cycle-sensitive in a specific way: managed-care margins move with the medical cost trend, and FY2025–FY2026 sit at a cost-trend trough. Consensus normalized EPS falls from $13.93 (FY2025) to $5.16 (FY2026) — the guidance-cut year — then recovers to $9.29, $12.93 and $20.30 through FY2029 as Medicaid rates reprice and the Marketplace/Medicare books readjust. Normalization has to look through the trough.
Two independent routes converge on roughly the same place:
From consensus forward FCF (next section): the FY2026–FY2028 average raw FCF is ~$1,259M; subtracting a normalized $100M of SBC and a $200M ongoing acquisition run-rate (a modest round-up of the $171M trailing 5-yr average, given Molina's continued M&A cadence — it closed the $350M ConnectiCare acquisition on 1 February 2025 [10]) leaves ~$959M adjusted → 8.1%.
From mid-cycle earnings power: consensus mid-cycle net income lands near $1.0–1.2B (EPS ~$13–20 on ~53M shares). Adding depreciation and amortization (~$200M) less capex (~$130M), with through-cycle working capital near zero, gives ~$1.07–1.27B of FCF; less the same $300M of SBC and acquisitions leaves ~$770–970M adjusted → 6.5%–8.2%.
The assumptions a skeptic should test: (1) medical cost trend normalizes by FY2027 so the FY2026 EPS trough is genuinely a trough; (2) acquisition spend stays near its ~$200M/yr trailing pace rather than stepping up; (3) working capital neither drains nor releases cash on average through the cycle. Loosen (1) — cost trend stays elevated into FY2028 — and the normalized yield falls toward 6%; tighten acquisitions to zero and it rises toward 9–10%.
The consensus check
Consensus forward FCF (CapIQ, via data/sp/estimates.json, generated 22 July 2026) is the anchor, because the framework's own forward feature reads directly off it. The near-term FCF profile is lumpy — FY2026 is inflated by the reversal of the FY2025 working-capital drain, FY2027 gives some of it back — so the multi-year average matters more than any single year.
Raw yield = consensus mean FCF ÷ $11.9B market cap (matches fit_features.consensus_forward_yield). Adjusted yield subtracts $100M normalized SBC + $200M acquisition run-rate before dividing. Source: CapIQ consensus, data/sp/estimates.json; derived.
Raw consensus FCF clears the 10% bar in three of the four forward years and averages 10.6% over FY2026–FY2028 ($1,259M ÷ $11.9B). After the framework's SBC and acquisition haircut it averages ~8.1% — the fortress bar is essentially met on consensus's own numbers, the 10% default bar is not.
That places Molina between the two canonical readings. The setup is not "consensus disagrees" — the sell side already models FCF back above the fortress line by FY2026. It is closer to fear: the equity fell 66% while consensus carries $1.3B+ of normalized FCF. But it is not the clean Centene case where consensus forward FCF clears the default bar outright; here the adjusted number lands ~190 bps under it, so the reversion underwrite must be explicit rather than assumed.
The mean-reversion path. The mechanism is the managed-care repricing cycle. Molina's FY2025–FY2026 margin compression is a cost-trend forecasting miss — the same category of error the framework hunts in insurers — and Medicaid rates reset actuarially on a 6–12 month lag, with Marketplace and Medicare bids repriced annually. Consensus embeds exactly this: normalized EPS recovering from the $5.16 FY2026 trough back above the FY2025 $13.93 level by FY2029. My estimate: roughly a 70% probability the normalized adjusted FCF yield holds at or above the 8–9% fortress bar within one to three years — this is consensus-backed, not a stretch — but only about a 45% probability it clears the stricter 10% default bar sustainably, which needs either the acquisition drag to shrink or margins to run above mid-cycle. What consensus would have to concede for the underwrite to fail: medical cost trend staying elevated past FY2026 so rates never catch up, or a collapse in Marketplace enrollment if the enhanced ACA premium tax credits lapse — a real, dated risk to Molina's Marketplace book that the Damage Math trial weighs.
FCF-to-revenue conversion
The framework treats a deteriorating FCF/revenue trend as a strike against the flywheel, so it deserves a straight look.
Reported FCF ÷ revenue. Source: FY2019–FY2025 10-Ks [11]; derived.
Conversion is low, volatile, and ends the period falling — 9.4% in FY2020 to −1.4% in FY2025, with a cumulative FCF/revenue of just 3.0% across the six years. Read literally, that undercuts the buyback flywheel: a business that converts 3% of revenue to cash cannot fund large repurchases from cash generation alone.
The counter-fact sits in the same statements. Revenue grew from $16.8B to $45.4B over the period, and for a government-payer insurer rapid premium growth consumes working capital — new members and new state contracts arrive with receivables and rate-settlement timing before the cash catches up. Net income never went negative, and Molina still bought back $1.0B of stock in each of FY2024 and FY2025 [12] — funded partly off the balance sheet, which is how the Self-Help buyback capacity has to be read. The conversion trend is the genuine risk to the yield case: it is the falsifier to watch, and if FCF/revenue does not recover as the FY2025 working-capital drain reverses, the normalization above does not hold.
Durability
Molina has grown revenue every stretch of the last decade ($17.8B in 2016 to $45.4B in 2025) with no three-year decline, so the framework's structural-decline disqualifier is not tripped. The conviction sources are mixed: a genuine regulatory-capital and licensing barrier and a 45-year operating record on one side; a market where revenue is not owned but re-bid on 3-to-5-year state contracts, and a government counterparty now legislating a Medicaid contraction (OBBBA), on the other. Free cash flow has printed negative in two of ten years. The gate turns on that combination.
What the year-10 gate asks
Ruchir's one pure gate is binary by construction: year-10 revenue and adjusted free cash flow higher than today, held with very high conviction — and any proper doubt fails it. Conviction is meant to come from structural sources (market structure, regulatory barriers, capital intensity, essentialness, long operating history), never from execution. This tab grades each source for Molina specifically, hunts the structural threats and quantifies the largest, checks the disqualifier flag, and states the read once. It builds on the market-position work in Business rather than repeating it.
The disqualifier check — revenue trajectory
The framework's one mechanical exclusion is revenue declining high-single-digit for three consecutive fiscal years after a long existence. Molina's revenue_trajectory feature records consecutive_decline_years of 0 and three_year_hsd_decline of false. Revenue fell in 2018 (−5.0%) and 2019 (−10.9%) — the aftermath of exiting several Marketplace states and a turnaround — but never three years running, and it has risen every year since, reaching $45.4B in 2025.
Source: FY2025 Annual Report (Form 10-K), Financial Highlights and prior-year 10-Ks; per fit_features.revenue_trajectory [1].
The disqualifier is not close to firing; the trajectory is up, roughly 2.5x over the decade, helped by Medicaid expansion, serial acquisitions, and Marketplace growth. What the gate cares about is whether that trajectory is durable for another decade, and that question is decided by the conviction sources and threats below, not by the disqualifier flag.
The conviction sources, graded for this company
Molina is a pure-play government-sponsored health plan — Medicaid, Medicare, and the ACA Marketplace — serving about 5.5 million members across 21 states, founded in 1980 [2]. It calls itself "the low-cost, most effective and reliable health plan delivering government-sponsored care" [3]. Against Ruchir's five conviction sources, the record is genuinely split.
Sources: FY2025 10-K Item 1 Business — Overview and Competitive Conditions [4] [5]; Contracts [6]; Licensing and Solvency [7]; Regulatory Capital [8].
Two sources clearly apply. The regulatory barrier is real: health plans are state-licensed and must hold statutory capital, and Molina's plans carried aggregate statutory capital and surplus of roughly $4.6B against a required minimum of about $3.1B at year-end 2025 [9]. A new entrant needs a license, several billion dollars of surplus, a provider network, and a track record before a state will award it members. The operating history is long — 45 years, through multiple rate and Marketplace cycles [10].
The source that only partly applies is the one the gate leans on hardest: market structure. Medicaid managed care is a concentrated oligopoly — the company's own named competitors are Centene, CVS, Elevance, and UnitedHealth, plus large not-for-profits [11]. But the oligopoly does not confer ownership of revenue. State Medicaid contracts "typically have terms of three to five years," are awarded by competitive RFP, and "incumbency status may not necessarily guarantee our ability to retain contracts when they are up for rebidding," with "increasing competition driven by renewed interest from large national health plans" [12] [13]. Molina must re-win its book every few years, contract by contract. That is closer to recurring competitive procurement than to the durable market structure the gate rewards.
The structural threats, hunted
Three of Molina's conviction sources — the barrier, the essentialness, the demand — all route through a single counterparty: government. That counterparty is also the largest structural threat, because the same regulator that keeps entrants out sets the rates, awards the contracts, and, through legislation, sizes the program itself.
The named, quantified threat: the One Big Beautiful Bill Act (OBBBA). Signed into law in July 2025, OBBBA legislates a contraction of the Medicaid program that funds three-quarters of Molina's premium. The company's own estimate is a 15% to 20% reduction by 2029 on its 1.2 million Medicaid Expansion members from work requirements, more frequent redeterminations, and cost sharing [14]. That is roughly 180,000–240,000 members, about 4–5% of Molina's 4.57 million-member Medicaid base [15] — a headwind, not a cliff. The heavier, slower lever is on the funding side: OBBBA also caps Medicaid provider payments and cuts the provider taxes states use to finance their share, changes scheduled to begin in 2028 that the company expects "may take 5 to 15 years to be fully implemented" and whose "impact is uncertain" [16]. This lands squarely inside the 8-to-20-year window the gate covers, and it is the government deliberately shrinking the addressable pool — the structural analog of "your margin is my opportunity."
Sources: FY2025 10-K Trends and Uncertainties [17] [18]; Contracts and concentration [19]; rate and redetermination risk [20] [21].
Marketplace is the second structural threat and the least durable segment. It grew from $2.5B to $4.5B of premium in a year [22], but it is subsidy-dependent and the rules are tightening: OBBBA limits which enrollees qualify for premium tax credits and requires pre-enrollment verification, phased over 2026–2028, while the June 2025 Marketplace Program Integrity and Affordability Rule shortens enrollment windows and eliminates the low-income special enrollment period — both expected to reduce Marketplace enrollment [23] [24]. Marketplace is only about 10% of premium, so this bounds the damage, but its year-10 contribution is genuinely uncertain.
Customer concentration is a real, structural feature, not a rounding item. Medicaid is 75% of consolidated premium, and Molina's contracts in California, New York, Texas, and Washington "each accounted for approximately 10% or more of our consolidated Medicaid premium revenues" in 2025 [25]. Losing any one of those four on a rebid would be a material, discrete hit — the flip side of a business whose revenue is re-competed rather than owned.
Rate adequacy and redeterminations are the loudest current problems, but they are cyclical, not structural, and belong to the dislocation rather than the year-10 gate. Rates are "most typically implemented by states on only an annual basis," and in recent quarters "our capitation rates have not kept pace with the sharp rate of that medical care cost increase," pushing the medical care ratio to 91.7% in 2025 from 89.1% in 2024 [26] [27]. The redetermination unwind cost roughly 675,000 members and left a higher-acuity pool that was mispriced until rates reset [28]. These compress a year or two of margin; the annual repricing mechanism is why they are the classic healthcare forecasting-error trigger the Damage Math tab tests, not a permanent impairment.
No substitution or technology threat of consequence. There is no Amazon-style entrant making Medicaid managed care obsolete; if anything, AI is a cost lever Molina is adopting, not a demand threat. The threat here is entirely regulatory and political — which is exactly where a government-funded business is most exposed.
FCF consistency (P2)
The deterministic adjusted-FCF stability series is not computable. fit_features.fcf_stability is empty and adjusted_fcf.latest_adjusted is null because the feature pipeline recorded stock-based compensation as missing for every year, so it could not build the rolling five-year adjusted-FCF average (not_computable.fcf_stability: "fewer than five consecutive adjusted-FCF years"). That limitation is stated, not filled by mental math. One caveat on the feature: the FY2025 10-K cash-flow statement does disclose SBC ($47M in 2025, $116M in 2024, $115M in 2023) and net cash paid in business combinations ($245M in 2025, $344M in 2024), both modest against reported FCF — so a properly computed adjusted series would sit only somewhat below the reported line, not collapse; it simply could not be assembled from the feed [29].
On a reported free-cash-flow basis, the year-to-year series is genuinely volatile — negative in 2018 (−$344M) and again in 2025 (−$636M).
Source: FY2025 Annual Report (Form 10-K), Consolidated Statements of Cash Flows, and prior-year 10-Ks; per fit_features.adjusted_fcf.series[].fcf [30].
The framework does not require smooth annual FCF; it requires a stable rolling five-year average, and tolerates occasional negative years for insurers and banks when they are business-model-inherent. On both counts Molina largely qualifies. The negative years are not underwriting blow-ups but working-capital timing: "we typically receive capitation payments monthly, in advance of payments for medical claims; however, government payors may adjust their payment schedules," and 2025's cash outflow was driven by "timing differences in settlement of government agency receivables and payables," together with lower operating income [31]. A single government payment shifting across a December 31 line moves reported operating cash flow by hundreds of millions — inherent to a business that collects fixed premiums from state and federal payors and settles MLR, risk-corridor, and risk-adjustment balances with them.
Smoothing removes most of the noise. The rolling five-year average of reported FCF has stayed positive and range-bound across the decade — and the two negative single years, 2018 and 2025, are seven years apart, the 5-to-8-year cadence the framework treats as normal, even healthy.
Source: derived from reported FCF, FY2016–FY2025 (this is the reported-FCF rolling average, not the adjusted series; fit_features.fcf_stability is not_computable) [32].
On the reported basis the five-year average never turns negative and holds between roughly $600M and $1.3B — stable, if lumpy. The honest caveat is that the average is thin relative to a $12B market cap and that 2025's dip reflects real margin compression, not only timing; but the P2 test — is the smoothed stream predictable, with negatives that are model-inherent — is met on the evidence available.
The year-10 case, both ways
The strongest case that year-10 revenue and FCF are higher. Revenue has compounded roughly 2.5x in a decade with no three-year decline; the disqualifier is clearly not tripped. Medicaid is essential, counter-cyclical coverage, and states keep outsourcing it to MCOs to control budgets [33]. Molina is a 45-year survivor inside a concentrated oligopoly, protected from startups by licensing and a $3.1B statutory-capital wall [34], and it is still adding contracts (Florida Kids in late 2026) and acquisitions. The reported FCF five-year average has stayed positive throughout, and consensus, tracked in Yield, has free cash flow rebounding sharply after 2025 (fit_features.consensus_forward_yield). On base rates, revenue a decade out is more likely higher than lower.
The strongest doubt. The gate does not ask whether the outcome is likely; it asks whether it is held with very high conviction on both revenue and adjusted FCF, and it fails on any proper doubt. Two structural features deny that conviction. First, the revenue is not owned — it is re-competed on 3-to-5-year state contracts where "incumbency status may not necessarily guarantee" renewal, with four states each above 10% of Medicaid premium [35] [36]. Second, and heavier, the government counterparty is legislating a contraction of the very program that is 75% of premium: OBBBA's 15–20% Expansion cut by 2029 and provider-payment limits whose impact the company itself calls "uncertain" and expects to unfold over 5–15 years — exactly the gate's horizon [37]. Layer on an FCF stream that has printed negative twice in ten years and an adjusted series that cannot even be computed, and "very high conviction" on the FCF leg is not available.
The read. On base rates and the 45-year record, year-10 revenue and the smoothed FCF average are more likely higher than not, and the structural-decline disqualifier is not tripped. But the gate is binary and fails on genuine doubt, and here the doubt is genuine: the moat is a regulatory barrier owned by the same counterparty now shrinking the program behind it, the revenue is re-bid rather than held, and the FCF leg is both volatile and, on the adjusted basis the framework requires, unmeasurable. That is not a prediction that Molina declines — it is the plain statement that the very-high-conviction the gate demands, on both legs, is not present. On the framework's binary standard, there is a genuine doubt, and the gate does not clear.
Self-Help
Molina can outlast its cost-trend problem: no debt matures before 2028, a $1.25 billion revolver sits undrawn, and corporate leverage runs at ~48% of capital against a 60% covenant. It bought back $1.0 billion of stock in each of 2024 and 2025 — cutting the share count 8% last year — and has $500 million of authorization left. Two frictions temper the flywheel: management ranks repurchases third behind organic growth and acquisitions, and the freely-deployable cash sits at the parent, not on the consolidated balance sheet.
The balance sheet against the problem's duration
The dislocation here is a one-to-two-year medical-cost-trend miss that reprices through the 2026–2027 rate cycle (Dislocation, Damage Math). The relevant question for capital allocation is whether debt maturities or covenants force cash toward the lenders during exactly those years. They do not.
Source: FY2025 Annual Report (Form 10-K), Note 11 "Debt," contractual maturities table [1].
The ladder is deliberately long-dated. Nothing comes due in 2026 or 2027; the first maturity is the $800 million 4.375% notes in 2028, then $650 million in 2030, with the remaining $2,350 million spread across 2031–2033 [2]. Total principal is $3,800 million ($3,766 million carrying, net of issuance costs), and management puts the weighted-average life at roughly five years and the weighted-average coupon at 5.0%. As debt matures, Molina "typically engage[s] in a new private offering of debt to retire and replace the prior issuance" — the November 2025 issuance of $850 million of 6.500% notes due 2031, used to repay $740 million of term-loan borrowings, is the pattern in action [3].
Long-Term Debt ($M)
Undrawn Revolver ($M)
Debt / Capital
Interest Coverage (x)
Sources: FY2025 10-K balance sheet and Note 11 "Debt" [4]; covenant terms, Note 11 [5]. Debt/capital = $3,766M debt ÷ ($3,766M + $4,069M equity); interest coverage = $781M FY2025 operating income ÷ $192M interest expense.
Liquidity is ample on the numbers that bind. The $1.25 billion revolving facility was fully undrawn at year-end and runs to November 2030 [6]. Corporate debt-to-capital sits at ~48%, below the 60% covenant ceiling, and FY2025 operating income of $781 million covered $192 million of interest ~4.1 times even in the trough year [7].
Two facts cut the other way and belong in the same breath. First, debt rose $843 million in 2025 (from $2,923 million to $3,766 million) — some of that funded the buyback rather than operations, which is a choice to lever into the repurchase, not a forced paydown, but it is leverage added at a weak-earnings moment. Second, on February 4, 2026 Molina amended the credit agreement to temporarily reduce the minimum interest-coverage covenant from 3.0x to 1.75x for the quarters through December 2026, stepping back up to 3.0x by late 2027 [8]. That amendment is management creating covenant headroom ahead of a depressed-earnings 2026 — prudent, but also a signal of how thin coverage could get. It bites only if the revolver is drawn; at year-end it was not.
Where the cash actually is
For a managed-care insurer, the consolidated balance sheet flatters the self-help case. Molina held $4,248 million of cash and $4,008 million of short-term investments — about $8.3 billion — but most of that is regulated statutory capital held at the health-plan subsidiaries, which need roughly $3.1 billion of minimum capital and can only dividend excess to the parent with regulatory notice [9]. The cash that can actually buy back stock lives at the unregulated parent — and there was only $223 million there at year-end, down from $445 million [10].
The buyback fuel is therefore a flow, not the headline balance: the health plans dividended $985 million up to the parent in 2025 (and $997 million in 2024), against which the parent funded $439 million of capital contributions back down to the plans, $192 million of interest, and the $350 million ConnectiCare purchase [11]. The CFO frames the number that matters plainly: parent cash was "a little over $200 million" in Q1 2026 and is expected to exceed $600 million by year-end on continued upstreamed dividends — "that's where we can actually use it to redeploy" [12]. The reference line: Molina can comfortably outlast a two-year cost-trend problem — no maturity wall, undrawn revolver, an intact dividend-upstream engine — but the buyback capacity is governed by that ~$1–1.5 billion annual parent flow, not by the $8 billion of cash a screen would show.
The repurchase record — executed, not just authorized
This is a company that repurchases, and the framework's hard-fail — a share count rising on stock-based comp or serial acquisition dilution — does not apply. Cash actually spent, straight from the cash-flow statements:
Source: derived from reported cash-flow statements, FY2019–FY2025 10-Ks; matches fit_features.share_count_trend.buyback_cash_per_year. FY2024–FY2025 detail from Note 13 "Stockholders' Equity" [13].
The tempo picked up as the stock fell. In 2025 Molina spent $1.0 billion: ~1,679,000 shares in Q1 at an average cost of $297.83, and ~2,849,000 shares in Q3 at an average cost of $175.50 [14]. The blended ~$220.85 sits fractionally below today's $224.82 — the Q1 tranche at $298 looks poor in hindsight, but the company leaned harder into weakness in Q3 at $175, buying 70% more shares for the same $500 million. The Q3 purchase came with an explicit valuation call from the CFO: "We see real value in our shares at current market prices, which we believe at this low point in the rate cycle underappreciate the longer-term margin targets of our business" [15].
The share count confirms real retirement, not optical churn:
Source: reported shares outstanding, FY2018–FY2025 10-Ks; matches fit_features.share_count_trend (5-yr CAGR −2.5%, rising = false).
Shares fell from 57.7 million (FY2024) to 52.9 million (FY2025) — an 8.3% reduction in a single year — and from 58.6 million five years ago, a 5-year CAGR of −2.5% [16]. (The 2018 peak of 66.6 million reflects convertible-note dilution long since worked off.) The authorization is live, not aspirational: an April 2025 board authorization of $1 billion runs through December 31, 2026, of which $500 million remained available as of February 10, 2026 [17].
Management's buyback intent, from the record
The brokers ask every quarter, and management's answer is consistent — and consistently ranks the buyback below other uses. Asked in Q2 2025 how repurchases fit against acquisitions, CEO Joseph Zubretsky was explicit: repurchases are "part of our capital strategy, but [rank] third in our priorities. The primary focus is on organic growth… The second priority is mergers and acquisitions, where we are acquiring companies just above their book value… we always have an eye towards share repurchase" [18]. In Q3 2025 he reaffirmed the ordering unchanged — "organic growth, inorganic growth, and returning capital to shareholders through share repurchase" — while noting Molina produces "$1.5 billion of capital capacity a year even at these compressed margins" [19]. The CFO sizes the choice as $1.5–2 billion of deployable "dry powder" over the coming year [20].
The tension for the flywheel is genuine and two-sided. On one side, Molina executed $1.0 billion of buybacks in the dislocation year, called its own stock cheap, and holds $500 million of remaining authorization. On the other, management's stated preference at maximum fear is to buy distressed local Medicaid plans "at or around book value" — which it argues is "as good or even better than winning a new contract" — and to fund organic growth first [21]. At the exact moment the framework wants repurchases to be the priority, they are the third-ranked use of capital. A material acquisition would compete directly with the buyback for that ~$1.5 billion annual flow.
Insider buying alongside is thin. Across SEC Form 4 activity, one director — Richard Zoretic — made an open-market purchase of 800 shares at $125.16 on February 11, 2026, the exact day the stock troughed at $122.65 — a genuine but symbolic ~$100,000. Otherwise the flow was routine equity grants and tax-withholding dispositions, alongside a handful of executive open-market sales (the Chief Legal Officer sold ~17,800 shares for ~$3.3 million at $186 in May 2026). There was no broad insider accumulation into the decline. (SEC Form 4 filings, as reported; no single-filing PDF page.)
The levered exception does not apply
The framework tolerates debt only where the adjusted yield is extreme (~25–40%) and paired with a demonstrated multi-year share-count halving. That path is moot here on two counts: the adjusted yield is not in that range (see Yield), and Molina is not a levered balance sheet in the framework's sense — corporate debt of $3,766 million sits against $4,248 million of cash, i.e. mechanically net cash on the parent's debt, with leverage of ~48% of capital and ~2.5x trailing EBITDA [22]. The self-help case rests on the ordinary buyback engine, not the levered exception.
The absurdity check
The deterministic float_retirement_years feature is not computable: adjusted FCF could not be derived (stock-based compensation is not separately captured in the financial feed for any year), and FY2025 reported free cash flow was negative at −$636 million — an outflow driven by the timing of Medicaid risk-corridor settlements and government receivables, not an earnings collapse (net income was still +$472 million), as the CFO underscored when he said parent cash flow, not consolidated operating cash flow, is what matters for a regulated insurer [23].
Illustratively, and not as a substitute for the feature: at the $11.9 billion market capitalization, consensus FY2026 free cash flow of ~$1.86 billion would retire the entire float in roughly 6.4 years; the ~$1.5 billion of annual capital capacity management cites implies closer to 8 years. Either figure is well outside the ~3-year "this cannot survive" zone the framework flags — the price is not making an arithmetic claim that a couple of years of cash flow could disprove. The honest version of the check is that it cannot be run on trailing adjusted FCF, and the forward illustration is ordinary, not absurd.
Dividend safety — not applicable
Molina pays no common dividend and states it intends to retain earnings to fund operations [24]. The return case leans entirely on the repurchase and the earnings recovery, not on a yield; dividend cover is therefore not part of this setup.
Management credibility
Zubretsky has run Molina since November 2017 — a long-tenured operator, not a serial promoter, and the acquisition and buyback commitments he has made have been delivered: eight acquisitions totaling roughly $11 billion of premium bought at ~22% of revenue, and $2.0 billion of repurchases across 2024–2025 [25]. That is not the promotional-CEO exclusion pattern of big claims with no follow-through.
The guidance record, however, is genuinely dented, and it is the sample that matters most here — three consecutive years of the year-opening EPS promise:
Sources: FY2023 result and FY2024 guide, Q4 FY2023 call [26]; FY2024 result, Q4 FY2024 call [27]; FY2025 guide and revised outlook, Q1 and Q3 FY2025 calls [28].
FY2023 beat: guided "at least $19.75," delivered $20.88 (+17%), squarely inside the then-stated 15–18% long-term target [29]. FY2024 missed: guided "at least $23.50," delivered $22.65, with management acknowledging "our full year results [fell] below our guidance" on fourth-quarter medical-cost pressure [30]. FY2025 missed severely: the year opened with guidance of "at least $24.50," reaffirmed in Q1, then cut to ~$19 and finally to ~$14 by Q3 as the cost-trend and Marketplace repricing hit [31].
Two readings coexist and the reader should hold both. The bear reading: back-to-back misses have hollowed out the "13–15% long-term growth" and "embedded earnings" framing the CEO has promoted, and insider ownership is low — all executive officers, directors and nominees hold 749,230 shares, just 1.44% of the company, so the skin in the game is modest [32]. The calmer reading: the FY2024 miss was modest and the FY2025 miss is the industry-wide medical-cost-trend forecasting error that is the dislocation the framework hunts — a repricing event, not a governance failure — and management met it by buying its own stock and disciplined acquisitions rather than by promotion. The instances above are the evidence; what would tip this toward the exclusion is a third guide-and-miss in 2026 with the stock talked up rather than repurchased.
Clock
Molina's dislocation was a 2025 Medicaid cost-trend miss, and the repair mechanism is mechanical: the state rate cycle catching up to a cost base management puts 20% above where it stood three years ago [1]. Management sizes that catch-up at roughly $7.25 of EPS toward a 2029 target of $25 [2]. The distinctive fact for this clock: the market has already re-rated the stock +83% off its February 2026 trough, and it now trades above the average analyst target.
What would close the gap
The dislocation this tab is timing is a healthcare forecasting error, not a broken franchise — the pattern of an insurer that mis-forecast one year's cost trend and was marked down as if the miss were permanent. What closes the gap is the repricing machinery of Medicaid itself, and three of its parts are already turning.
The rate cycle catches up to the cost base — on a dated, recurring calendar. Molina's 2025 medical cost trend ran 7.5%, of which 250 basis points was an acuity shift as low- and no-utilizers left the rolls after the post-pandemic redetermination [3]. Medicaid premiums are reset by each state on an actuarial cycle — a January 1 update for most states, plus off-cycle and retro adjustments through the year — so the fix is structural, not discretionary. Management's 2026 Medicaid MCR guide of 92.9% is built on rate increases of 4% against a 5% trend, with the note that "states continue to update their actuarial data to reflect higher observed trends" [4]. On the first-quarter call the CEO framed the mechanism plainly: states "are catching up" to a cost baseline "20% higher than it was three years ago," and because Molina runs "300 to 400 basis points better than the average market," margin should move "into much more positive territory" as they do [5]. The evidence it is in motion: the January 1, 2026 rate updates "came in as expected," first-quarter trend ran modestly favorable, and several states had already granted off-cycle rate increases that management flagged as upside to guidance [6].
Guidance resets against a deliberately low bar, and the reset quarter is now. Full-year 2026 is guided to "at least $5" of adjusted EPS on roughly $42 billion of premium [7] — a floor set after a year of downward revisions, against which a beat re-rates more than a raise from a stretched bar would. Management told the market it would reset the full-year number with second-quarter results: "when we report second quarter results, we will update our full year 2026 guidance … a time-tested base off of which to project the second half" [8]. That print lands July 22, 2026.
A mechanical earnings tailwind turns positive in 2027. Molina carries roughly $2.50 per share of "embedded earnings" — the drag from 2026 MAPD Medicare losses and Florida CMS first-year implementation costs — both of which management calls "certain to be positive impacts to our 2027 performance," with the MAPD product being exited for 2027 [9]. This is independent of the rate cycle: two known cost items roll off on a fixed schedule.
Management put the full bridge on a slide at its May 8, 2026 Investor Day. From the 2026 base of at least $5, it targets $25 of adjusted EPS by 2029 — $7.25 from "current revenue MCR recovery" (the rate catch-up), $6.00 from operating discipline, and $6.75 from revenue growth — and states the case that "current margin compression is cyclical and temporary" [10] [11]. The single largest component of that bridge is the rate repricing this tab is timing [12]. Buybacks add a fourth, smaller lever — the Self-Help tab covers the $1 billion-a-year pace that took the share count from 57.7 million (FY2024) to 52.9 million (FY2025).
The dated catalyst path
Sources: guidance-reset and rate-cycle commitments from the Q1 FY2026 earnings call [13] [14]; Q2 date from the consensus earnings calendar (as reported); Q3/Q4 windows from the company's historical late-October and early-February cadence.
Base rates from Molina's own history
Over a listed history back to 2003, Molina has fallen 30% or more from a prior high six times. The current decline is the deepest of them. The deterministic capitulation gauge dates the peak to the September 16, 2024 close of $360.77 and the trough to $122.65 on February 11, 2026 — a 66.0% fall over about 17 months; measured from the March 2024 all-time high of $419.53 the drop was 70.8%. Either way it is the deepest peak-to-trough decline in the name's history, and the volume capitulation the Dislocation tab documents places peak fear in early 2026, not at the start of the slide.
Source: derived from the run's daily price history, 2003–2026 (as reported). Depth = (trough close − peak close) / peak close; current-episode depth per the deterministic capitulation gauge (peak 2024-09-16, trough 2026-02-11).
Source: derived from the run's daily price history, 2003–2026 (as reported). Round-trip = trading days from prior peak to first close back at that peak; the current episode has not round-tripped.
Two patterns matter. In its mature large-cap era, Molina's one comparable-depth drawdown — the 2015–2018 ACA/Medicaid margin scare, down 47.6% — took roughly 29 months to round-trip; the shallower ~31% sector de-rates repaired in 8 to 10 months. The current fall is deeper than any of those, which on the name's own base rate argues a full round-trip to the prior high is a two-year-plus process, not an 18-month one. Against that, the partial recovery already in hand has been faster than the base rate: from the $122.65 trough the stock reached $224.82 by July 16, 2026, a +83% move in about five months, leaving it 37.7% below the September 2024 peak and 46.4% below the all-time high.
The 18-month test
Partial re-recognition within 18–24 months is a reasonable expectation, and much of the first leg has already printed; a full round-trip to the prior $360–$420 highs is not supported inside that window by the name's own history. The evidence for the near-term half: the January 2026 rate updates landed as expected, off-cycle increases are already arriving, the acuity shift is described as largely behind the book, and consensus has FY2027 adjusted EPS at $9.29 and FY2028 at $12.93 against an FY2026 trough of $5.16 — recovery that shows up in printed numbers over exactly this window. The evidence against a full round-trip on the same clock: management's own bridge routes the return to $25 of EPS through 2029, and the comparable 2015–2018 drawdown took ~29 months to fully repair. The read tied to the falsifier ledger: this clock runs on the Medicaid rate cycle funding a cost base 20% higher than three years ago. It is falsified if the 2027 rate updates fail to close that gap, if medical cost trend re-accelerates above the 5% assumption, or if the acuity shift proves not to be behind the book — any of which would turn a cyclical repricing into a structural margin reset, the distinction the Damage Math tab adjudicates.
What consensus expects, and when
The sell side is neither capitulated short nor crowded long. Of 19 covering analysts, 3 rate Molina a buy, 15 a hold, and 1 an underperform — a consensus that sat out both the fall and the bounce. More telling for a re-rating: after the +83% recovery, the stock at $224.82 trades above the mean price target of $210.76 and the median of $209 (targets range $129 to $286). The market has already priced in more recovery than the average analyst, which leaves the near-term re-rating dependent on the printed numbers rather than on the street catching up.
Source: analyst price targets and recommendations, CapIQ/consensus feed as of 2026-07-17 (n=17 targets, 19 ratings); current price from the run's daily price history.
The candidate quarter for re-recognition is the one reporting July 22, 2026: management pre-committed to resetting the full-year guide with second-quarter results, and it is doing so from a "at least $5" floor after a Q1 that beat and after off-cycle rate increases it had not yet banked. Beyond that, consensus itself locates the recovery in the FY2027 numbers — where the embedded-earnings drag reverses and the rate catch-up compounds — with the first full FY2027 outlook due at the early-February 2027 print. The forward-FCF-yield path underlying those estimates is the Yield tab's to adjudicate; it is lumpy on Medicaid receivable timing, computing to 15.6% on FY2026 consensus FCF and 9.6% on FY2028 against the current $11.9 billion market capitalization.
The instruments
Long-dated listed options on Molina exist. Standard monthly series are supplemented by LEAPS expiring January 15, 2027 and January 21, 2028 — the latter roughly 18 months out as of July 2026 — so an expression that spans the framework's 18-month-plus horizon is available on-screen. Liquidity is the deep single-name liquidity typical of an S&P 500 constituent; specific open-interest figures at each long-dated strike were not verifiable from the sources reviewed and are not estimated here.
Current 30-day implied volatility reads 63.86% (AlphaQuery, dated 2026-07-21). That sits in the elevated 60–70 band rather than the up-to-~50–55 range, and it is inflated by the July 22, 2026 earnings print that the options market is positioned around; it is a spot reading on an event date, not a settled level. Verdict: qualifying long-dated options exist. This section states instrument facts only — no strike, expiry, structure, or sizing is implied.
Sources: options-listing calendar and expirations from public options-chain data (Barchart, Investing.com), July 2026, as reported; 30-day implied volatility from AlphaQuery (MOH), 2026-07-21. No filing page backs these market-data facts; they are cited to their dated web sources rather than a PDF.