Molina Healthcare, Inc.'s management explains the business in its own materials. The slides below do the most of that work, pulled from the documents preserved in Sources. Each source link opens the complete presentation at that slide in a new tab.
Management's fullest current statement: what Molina is, how the four growth engines work, why 2025's margins broke, and the path to $25 EPS by 2029. · Open the full document →
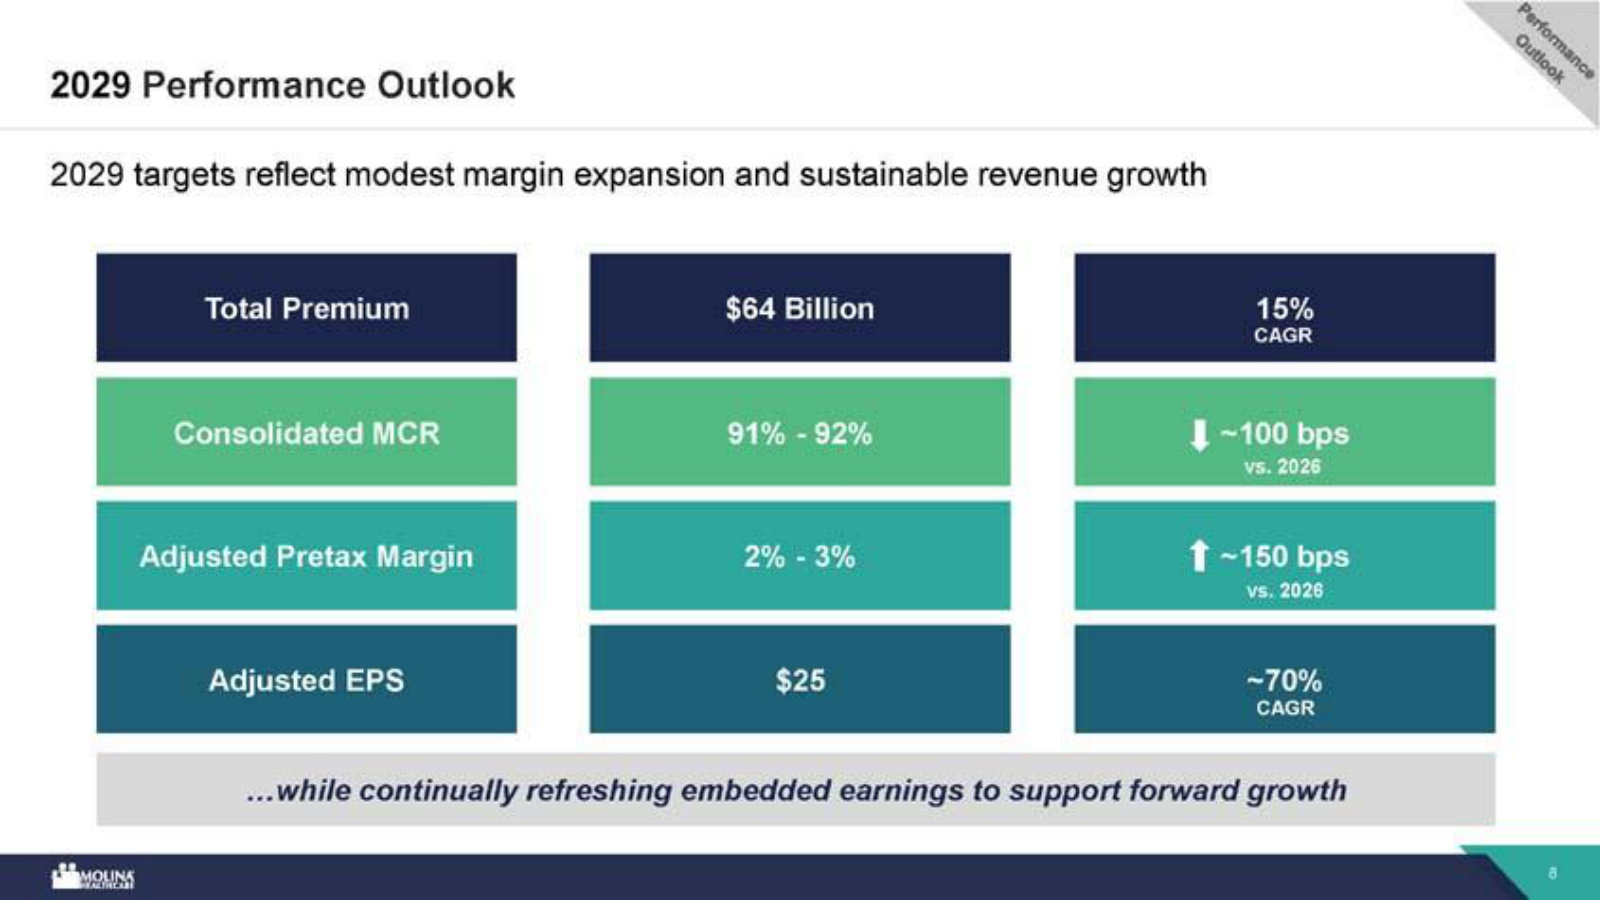
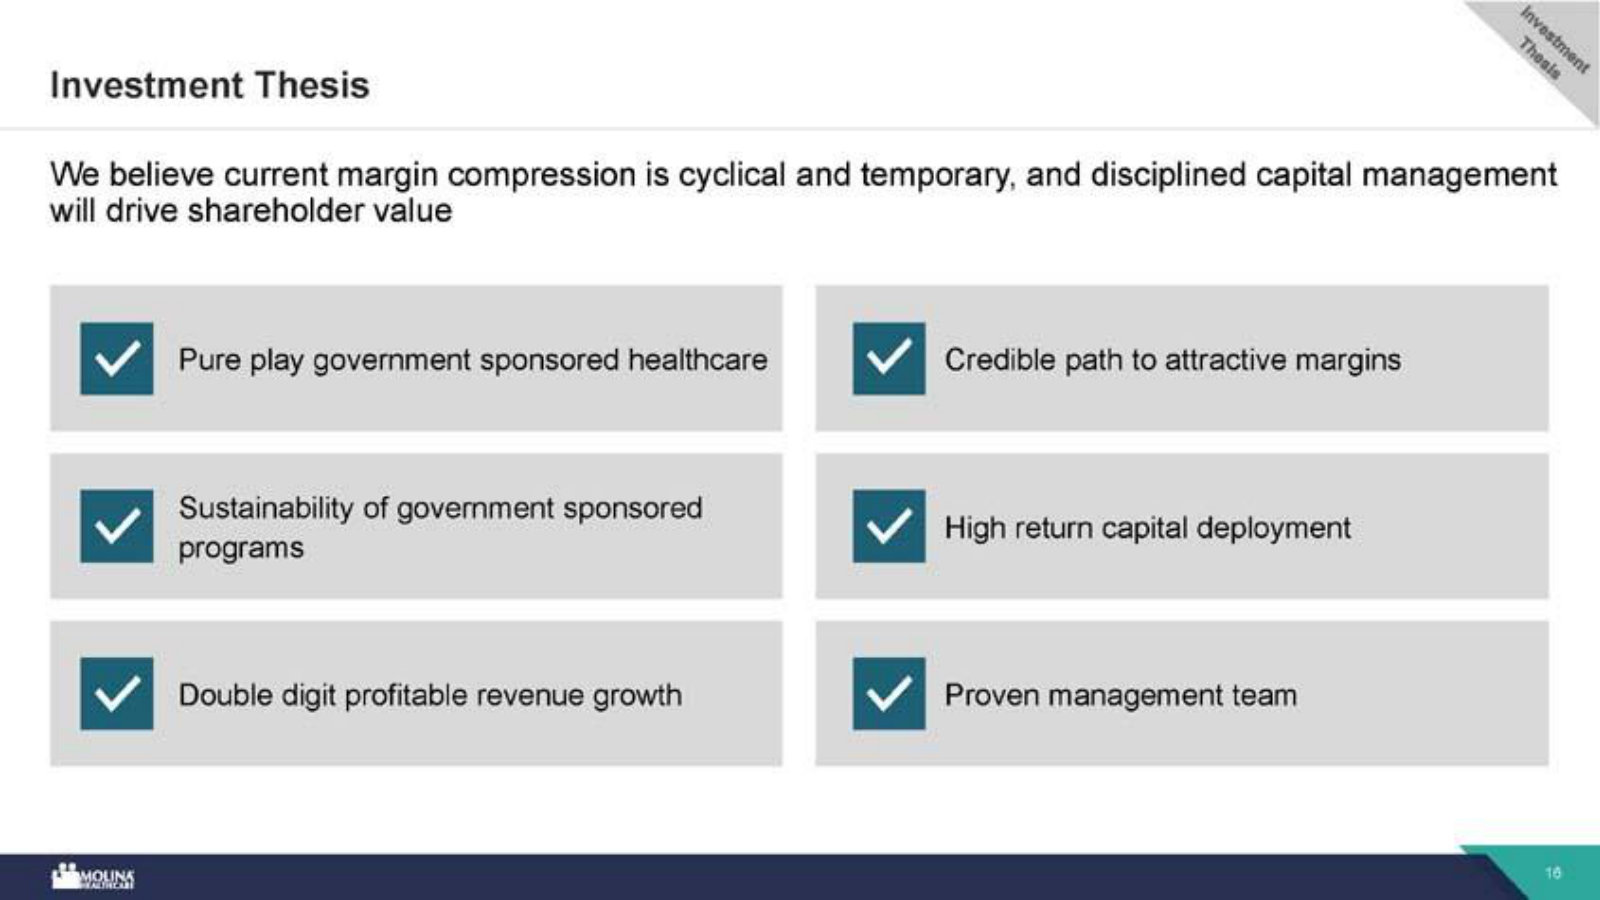
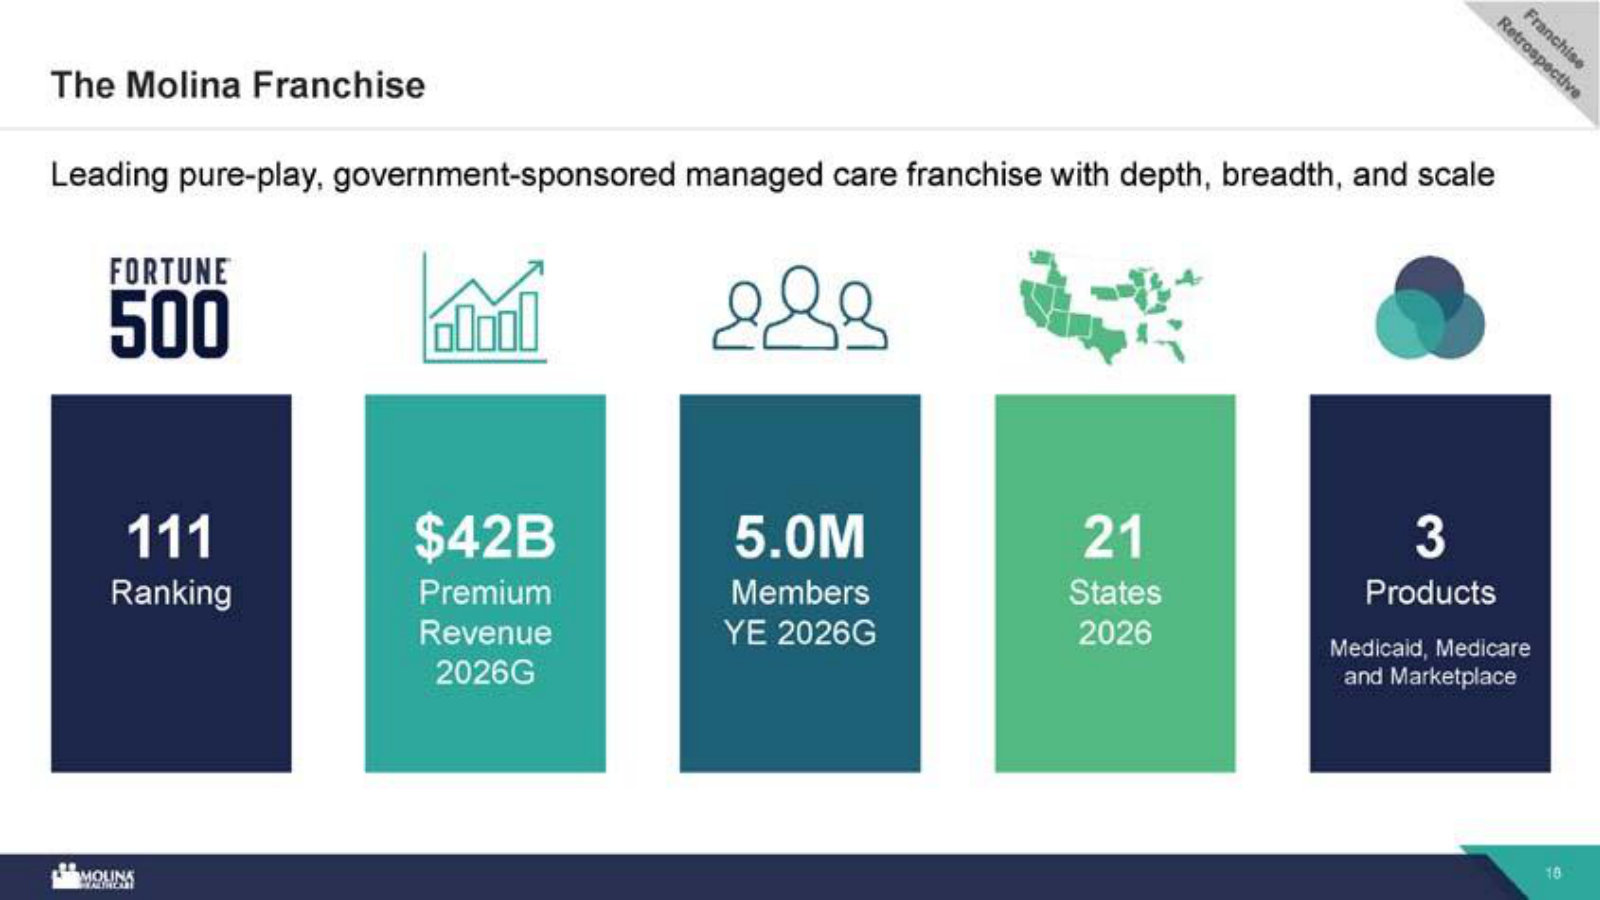
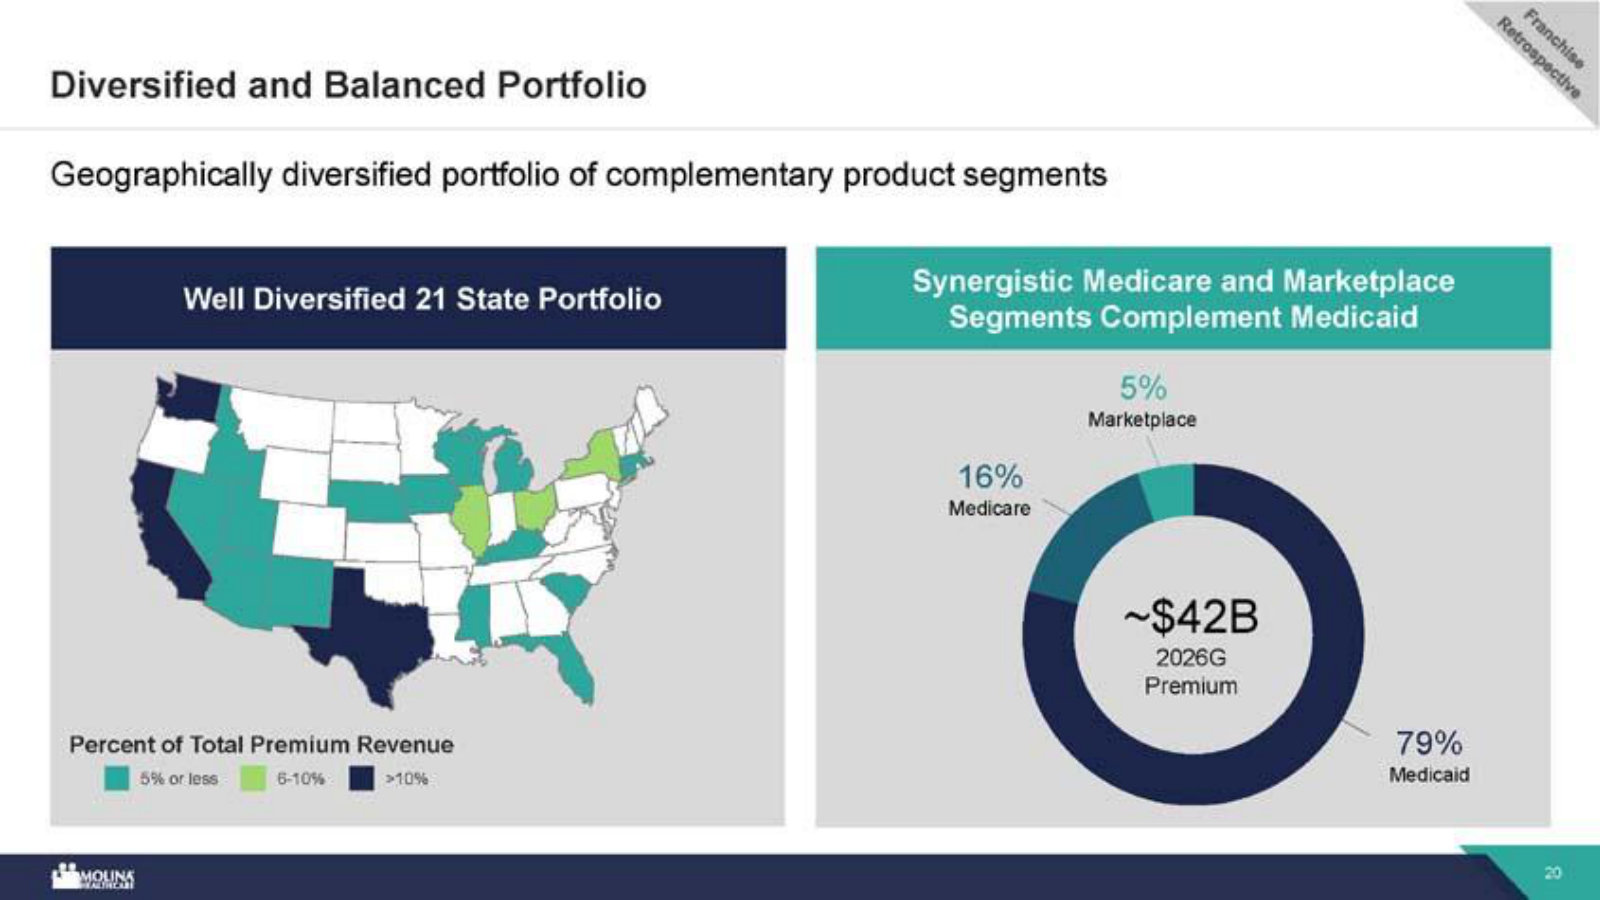
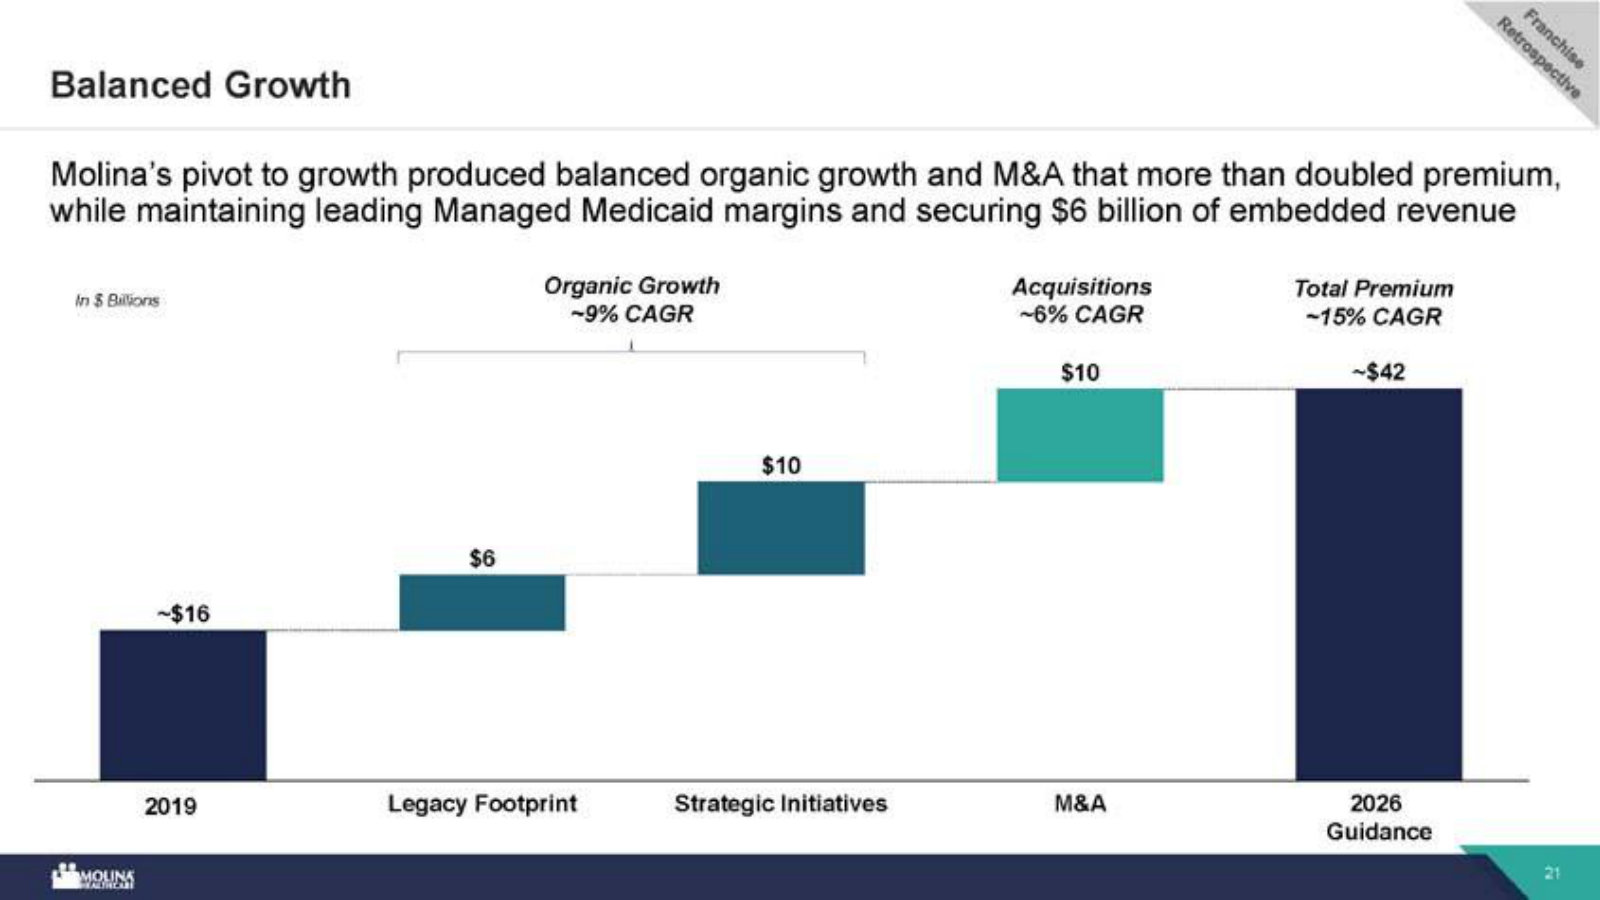
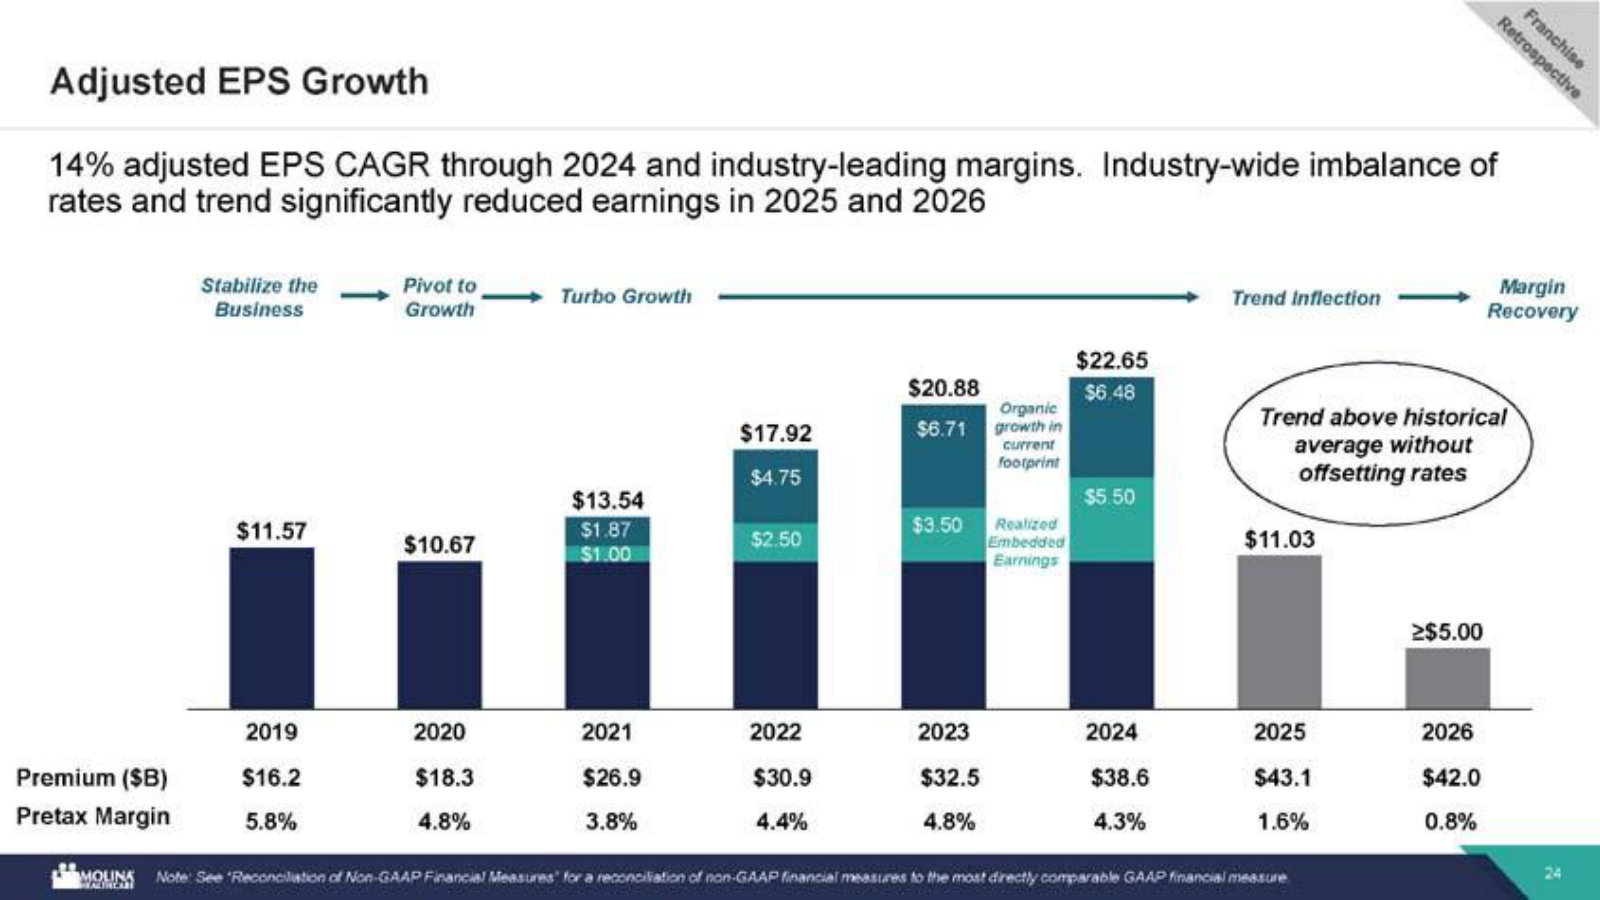
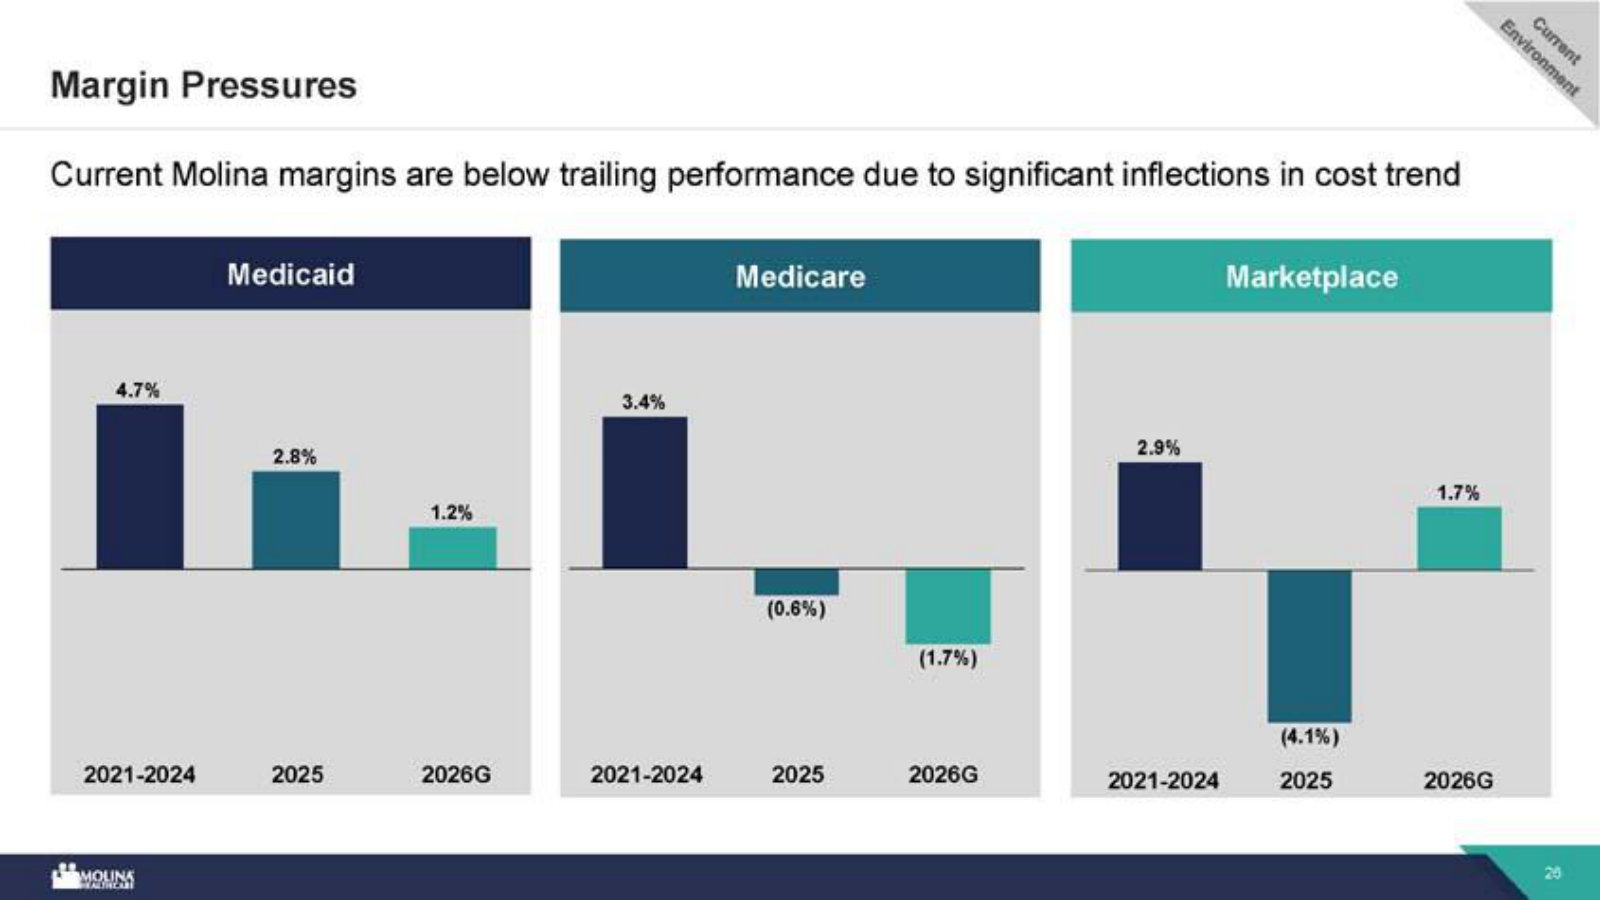
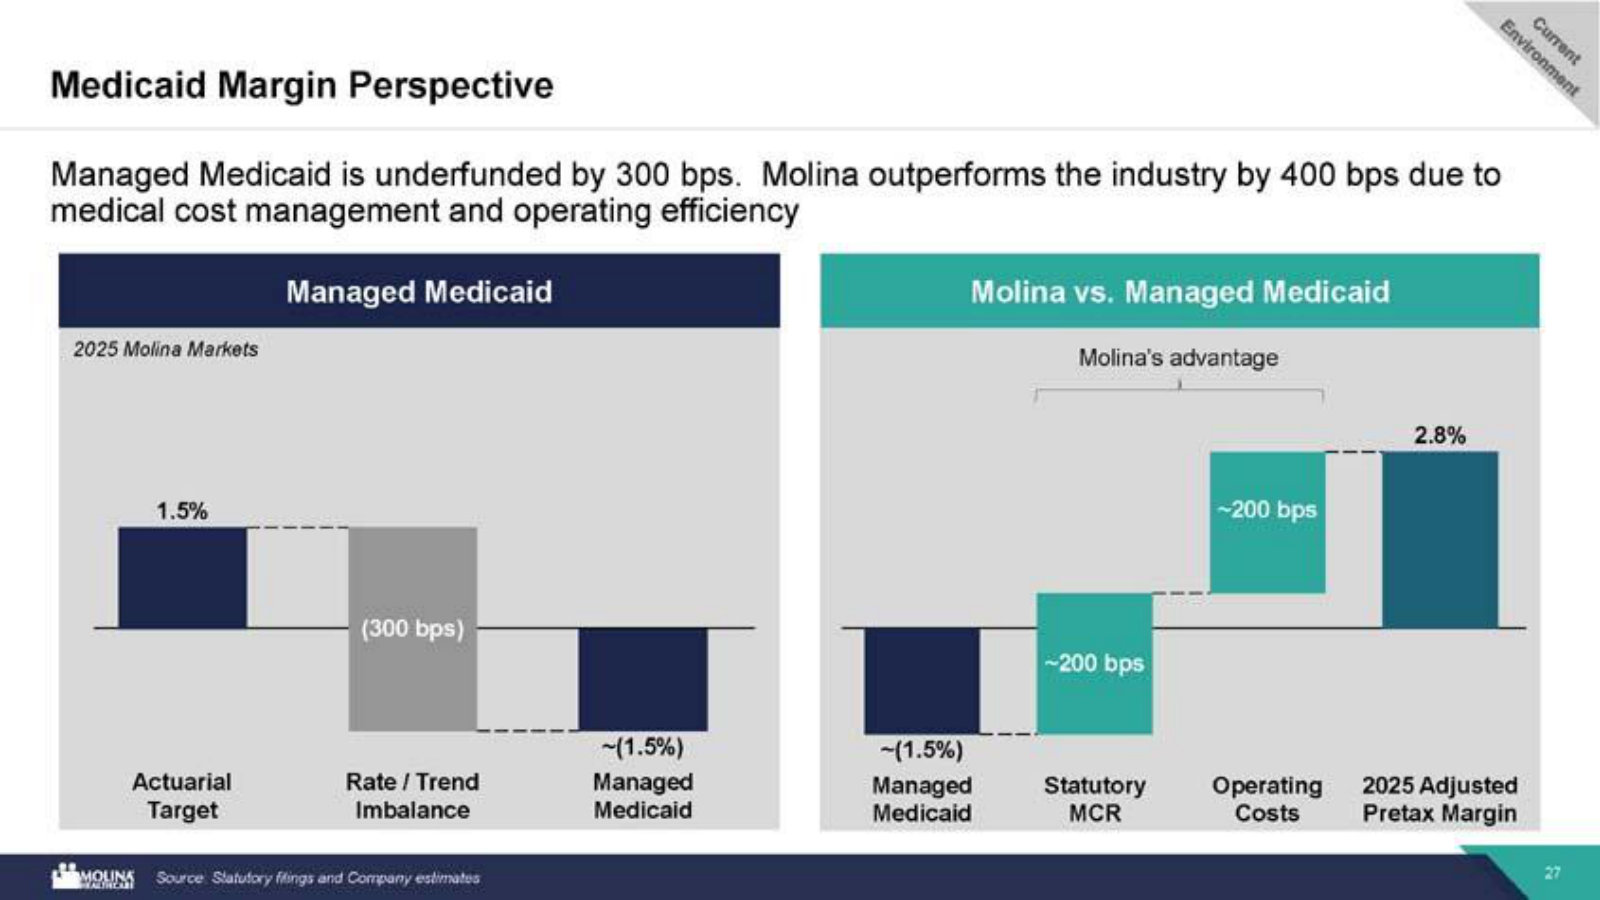
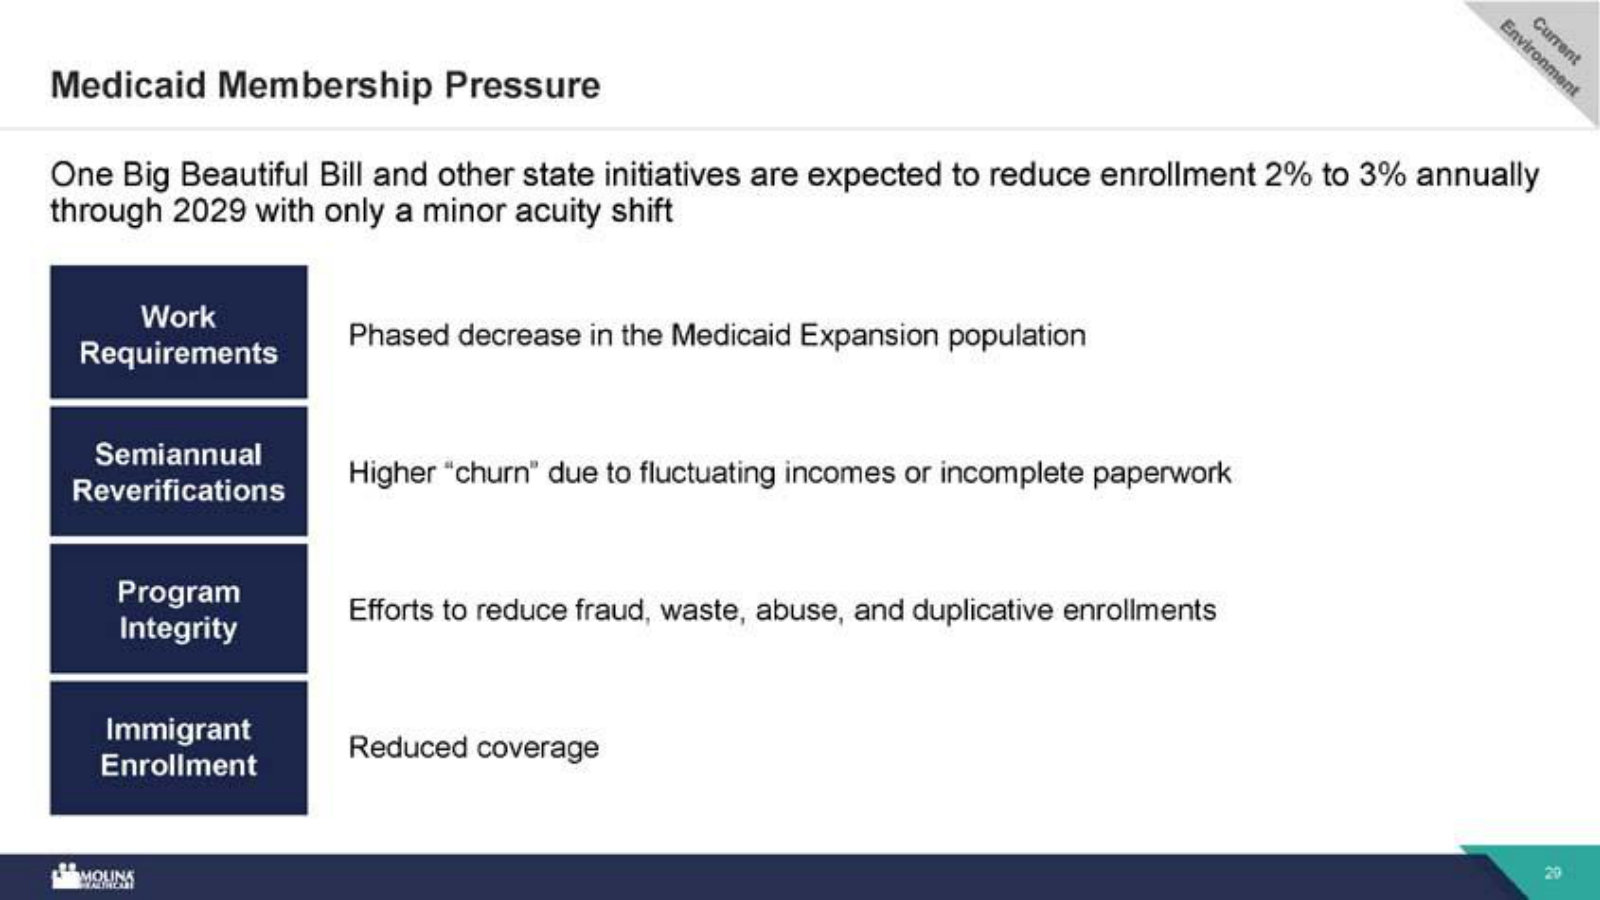
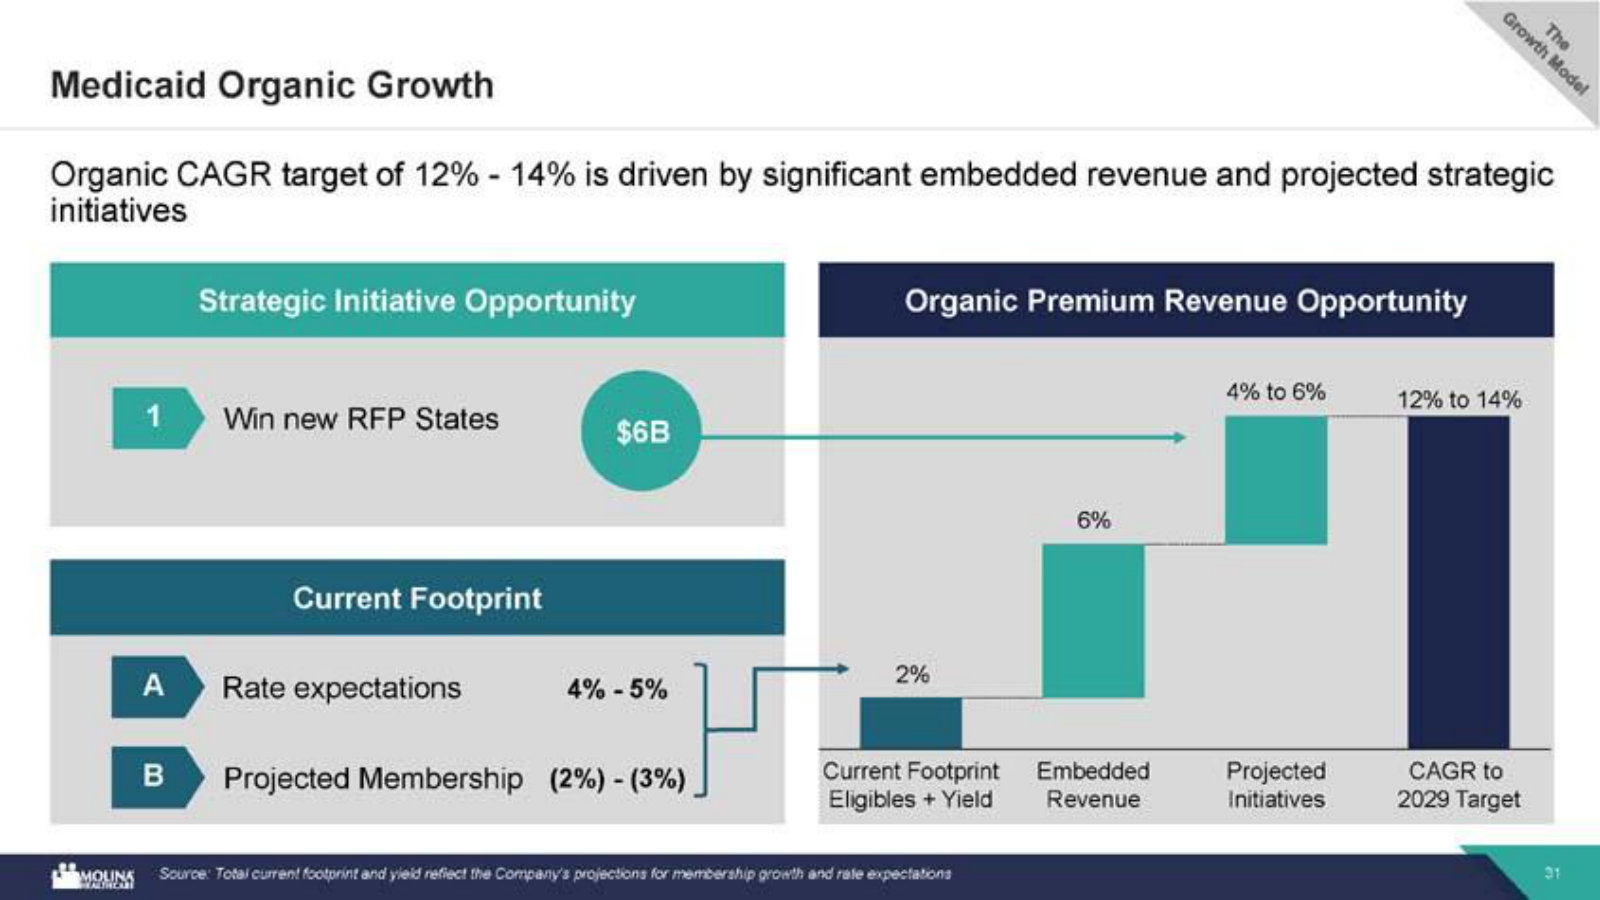
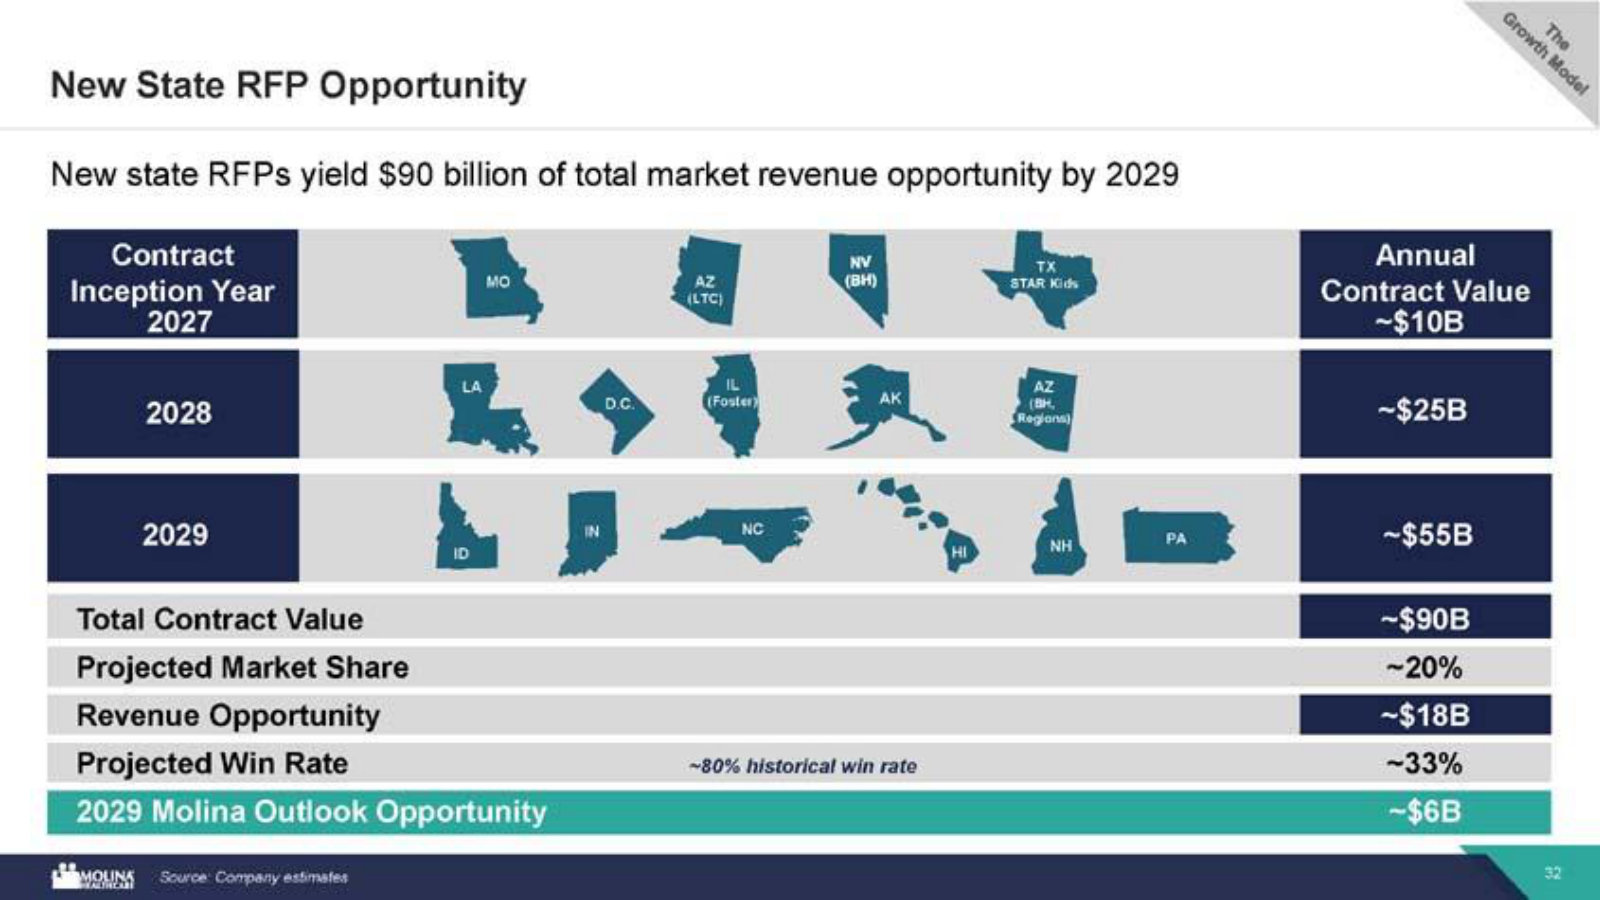
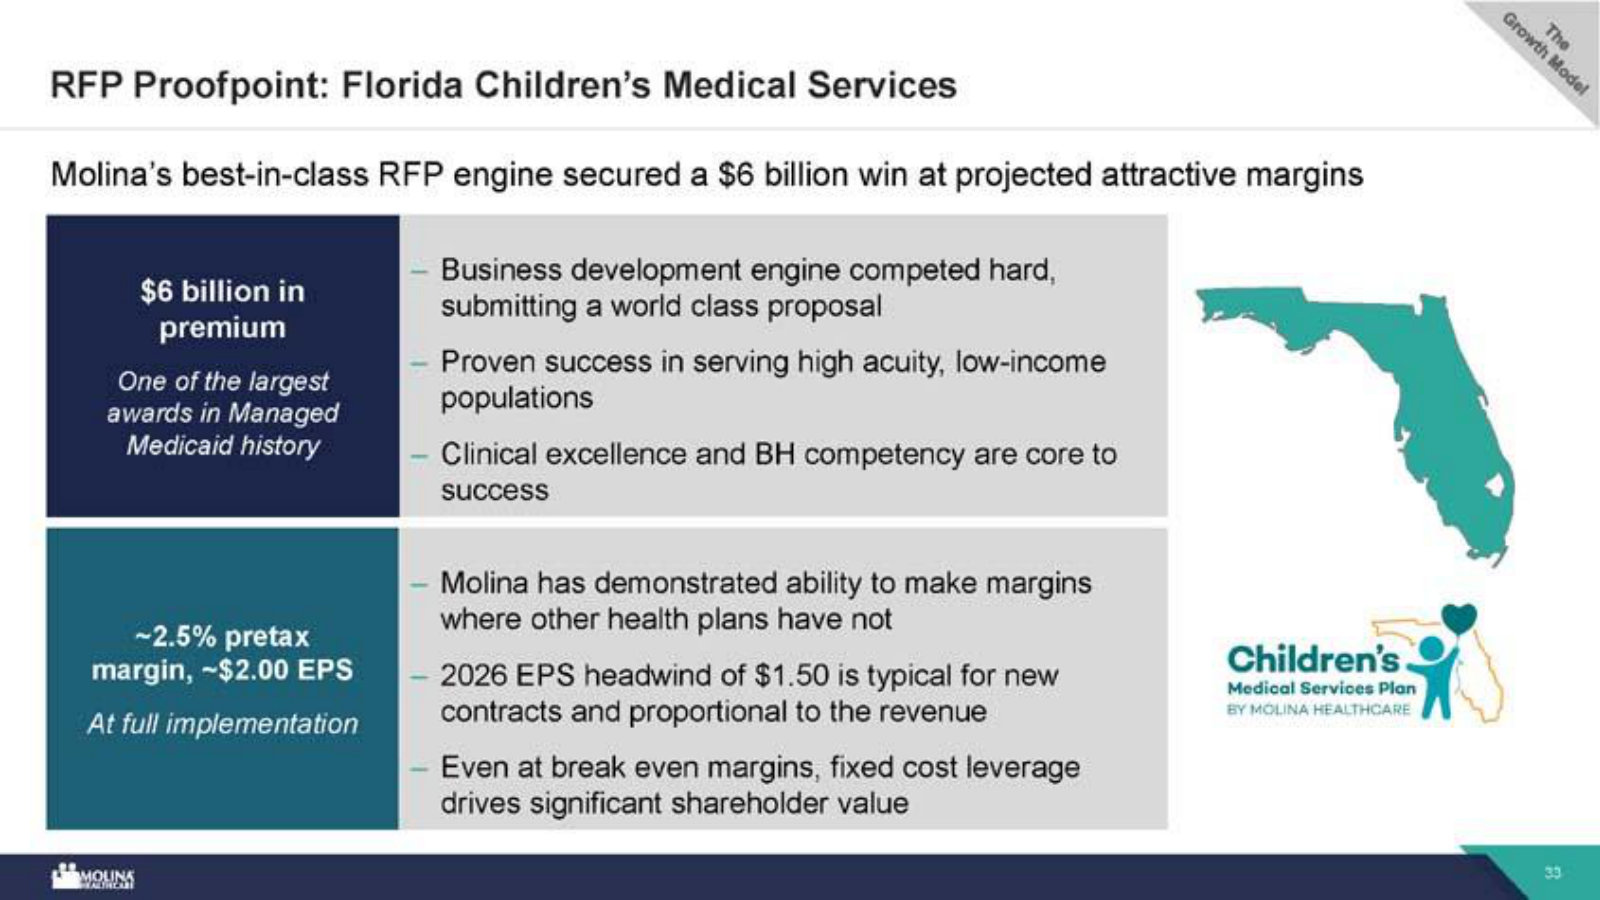
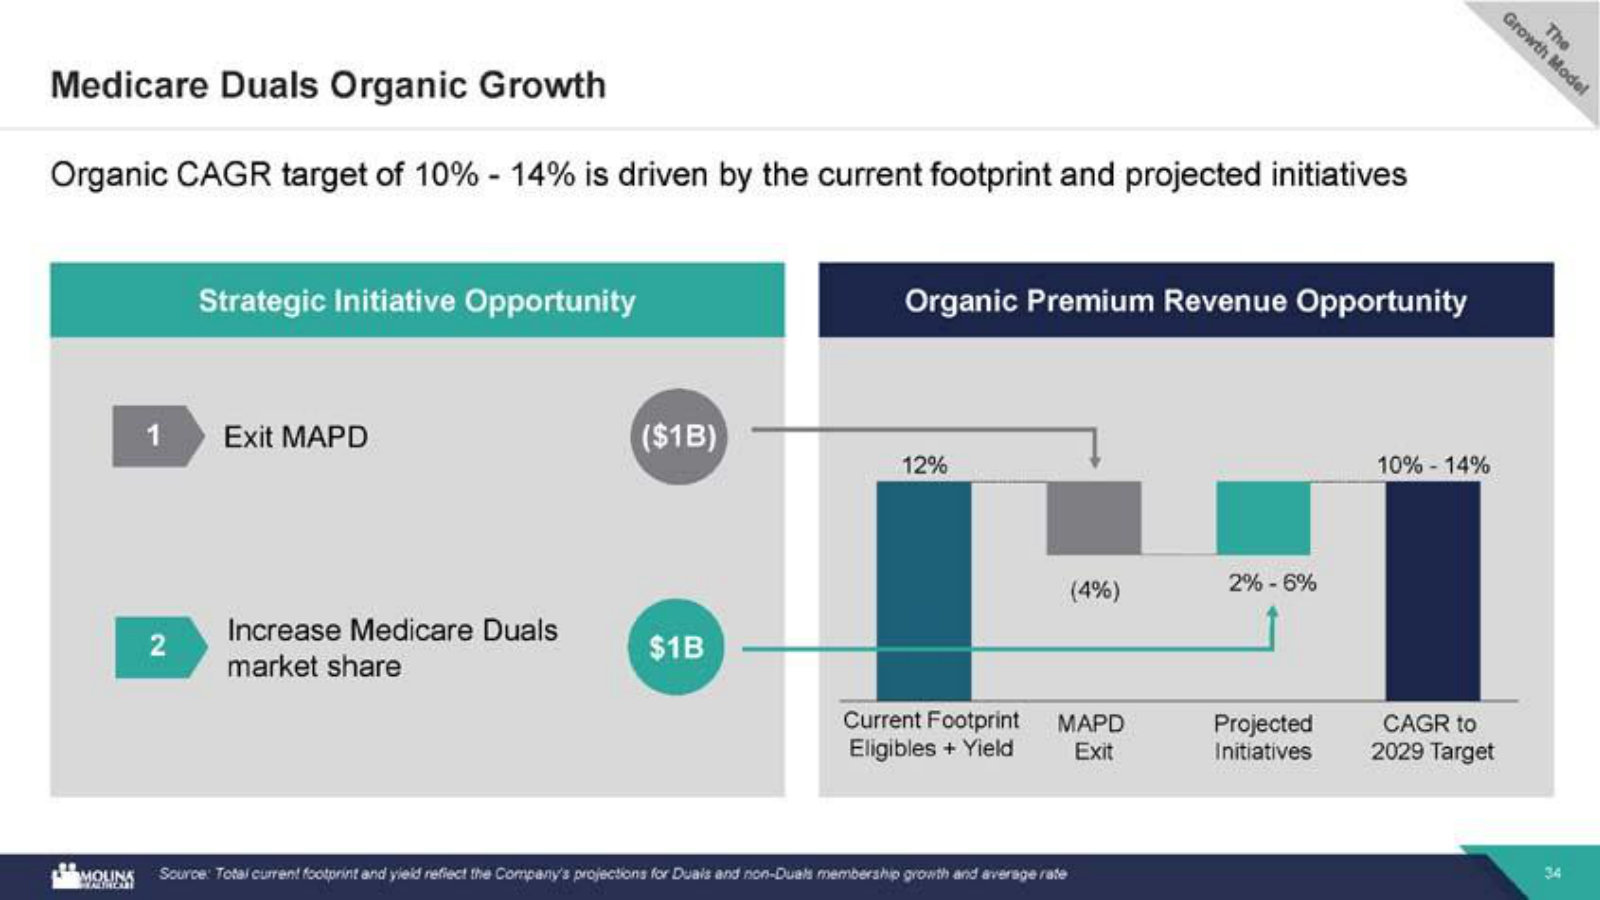
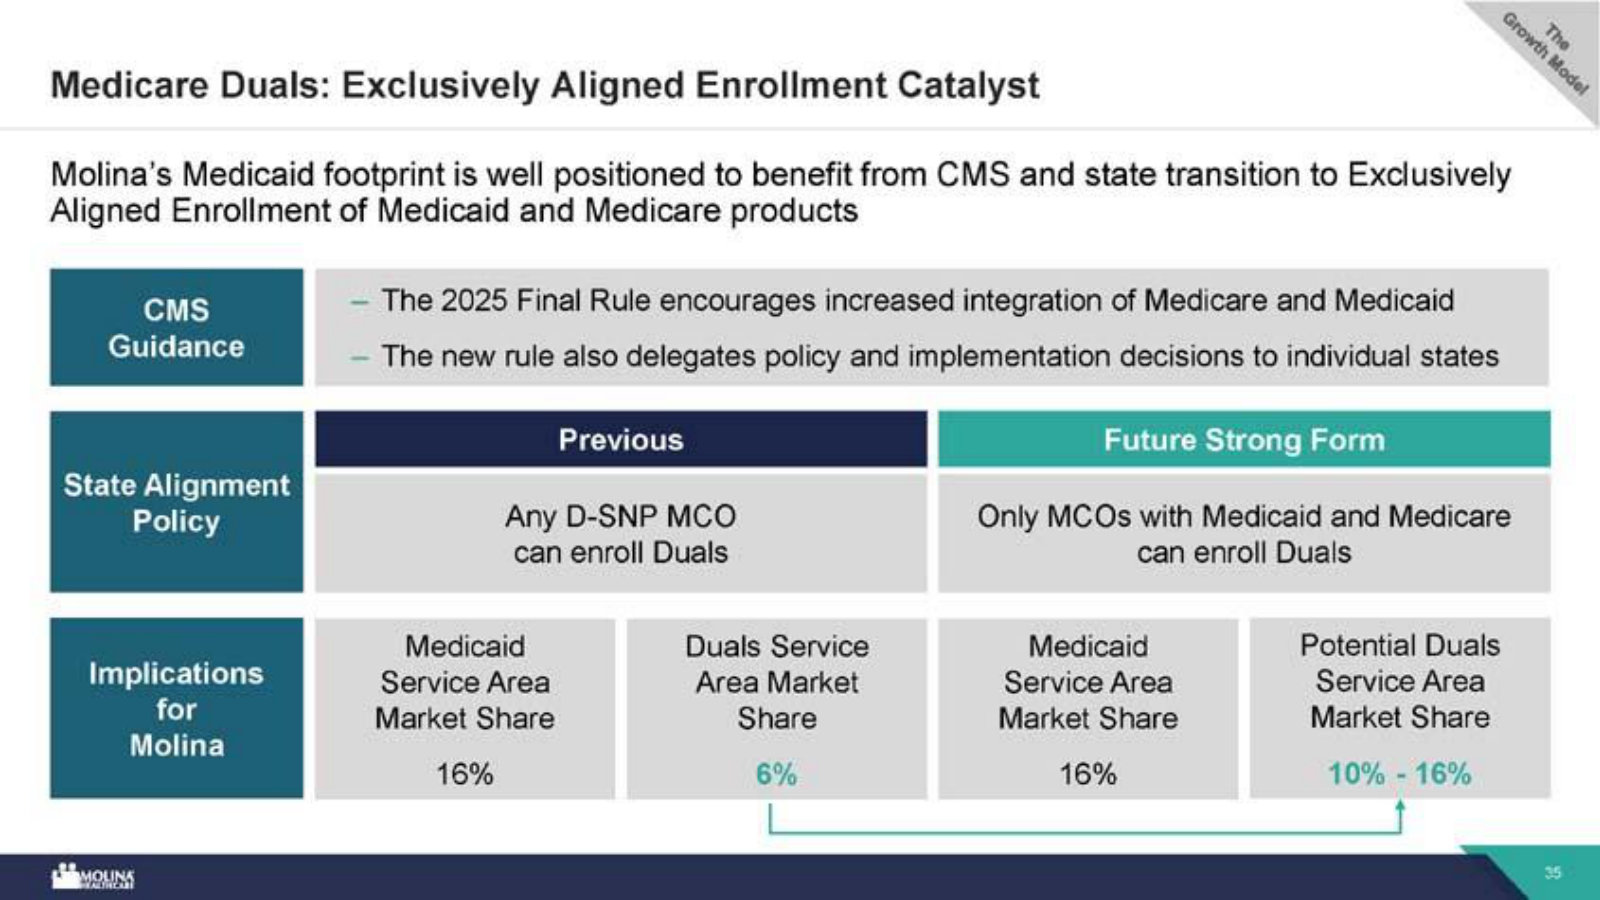
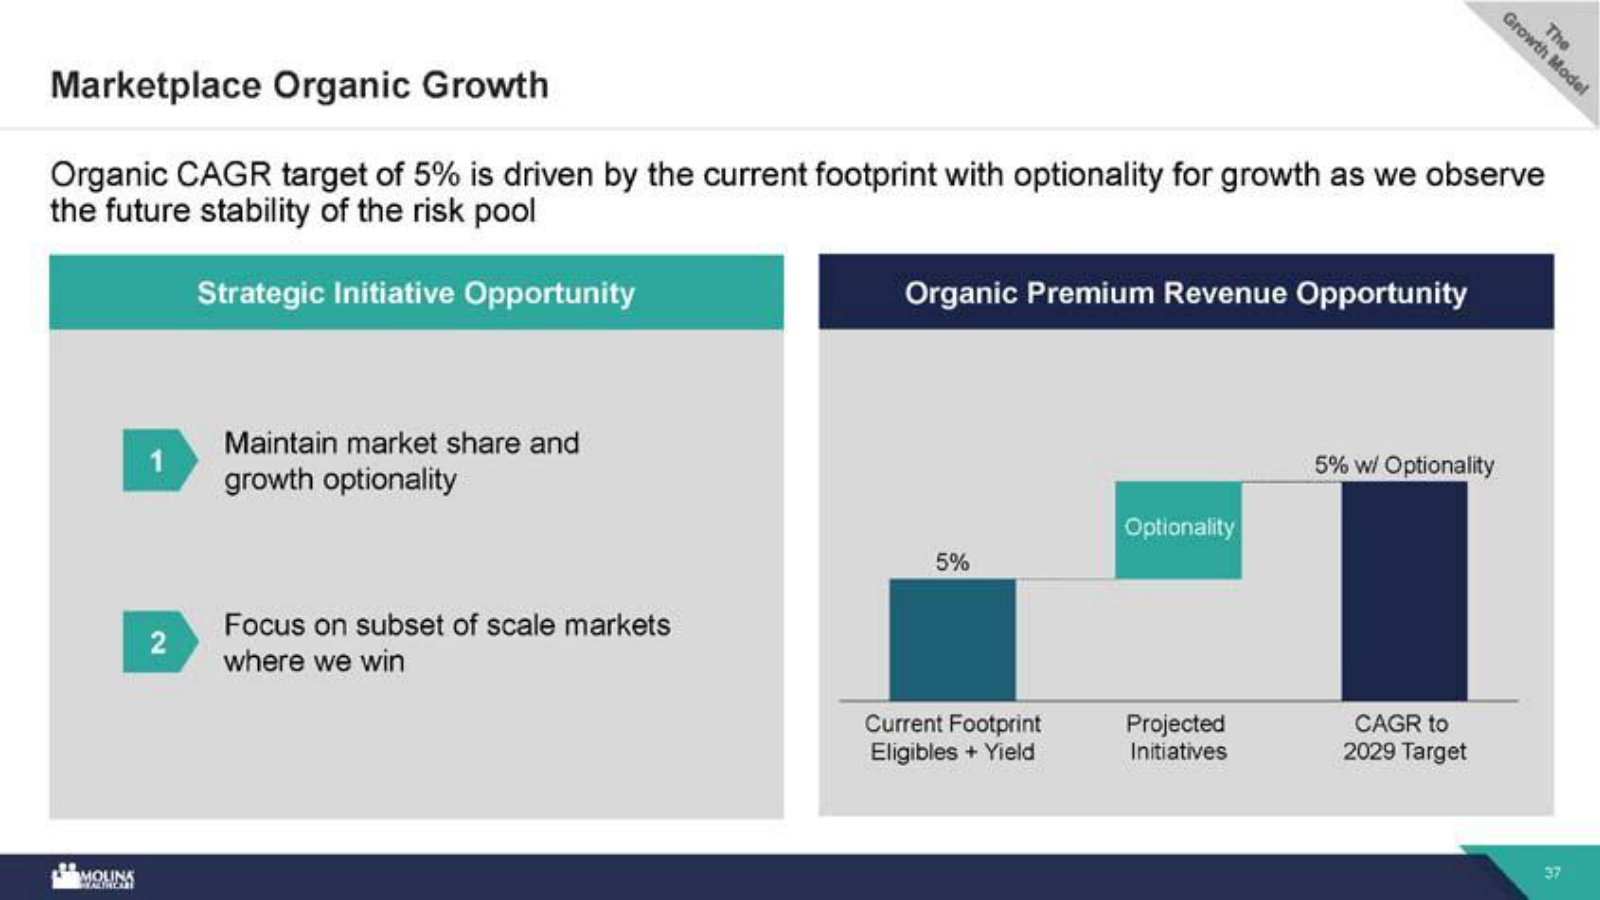
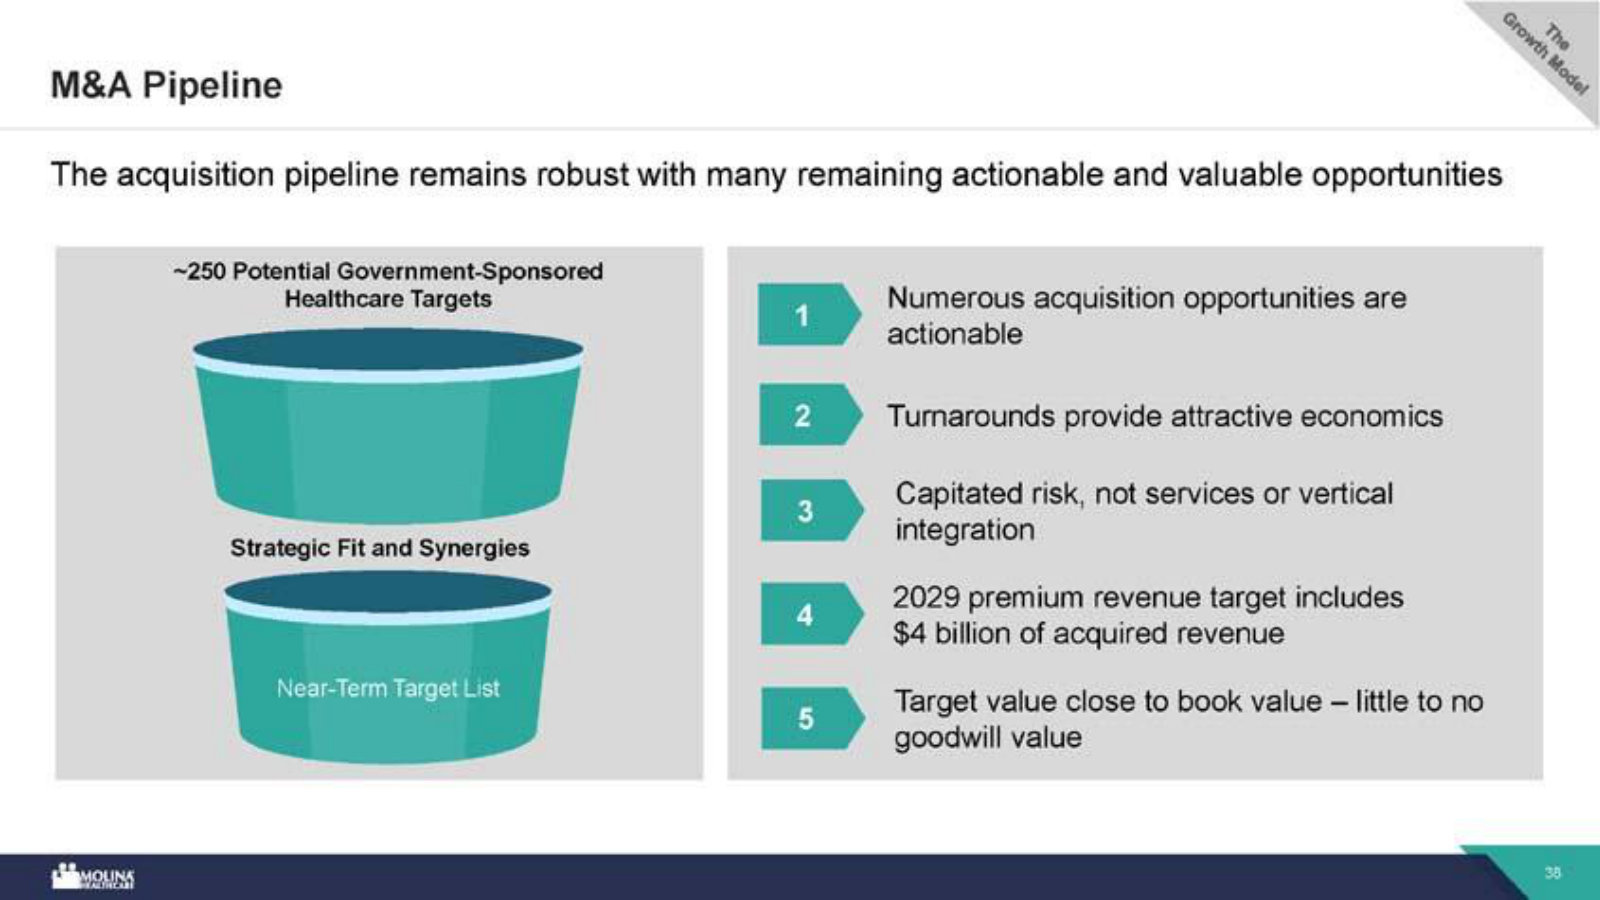
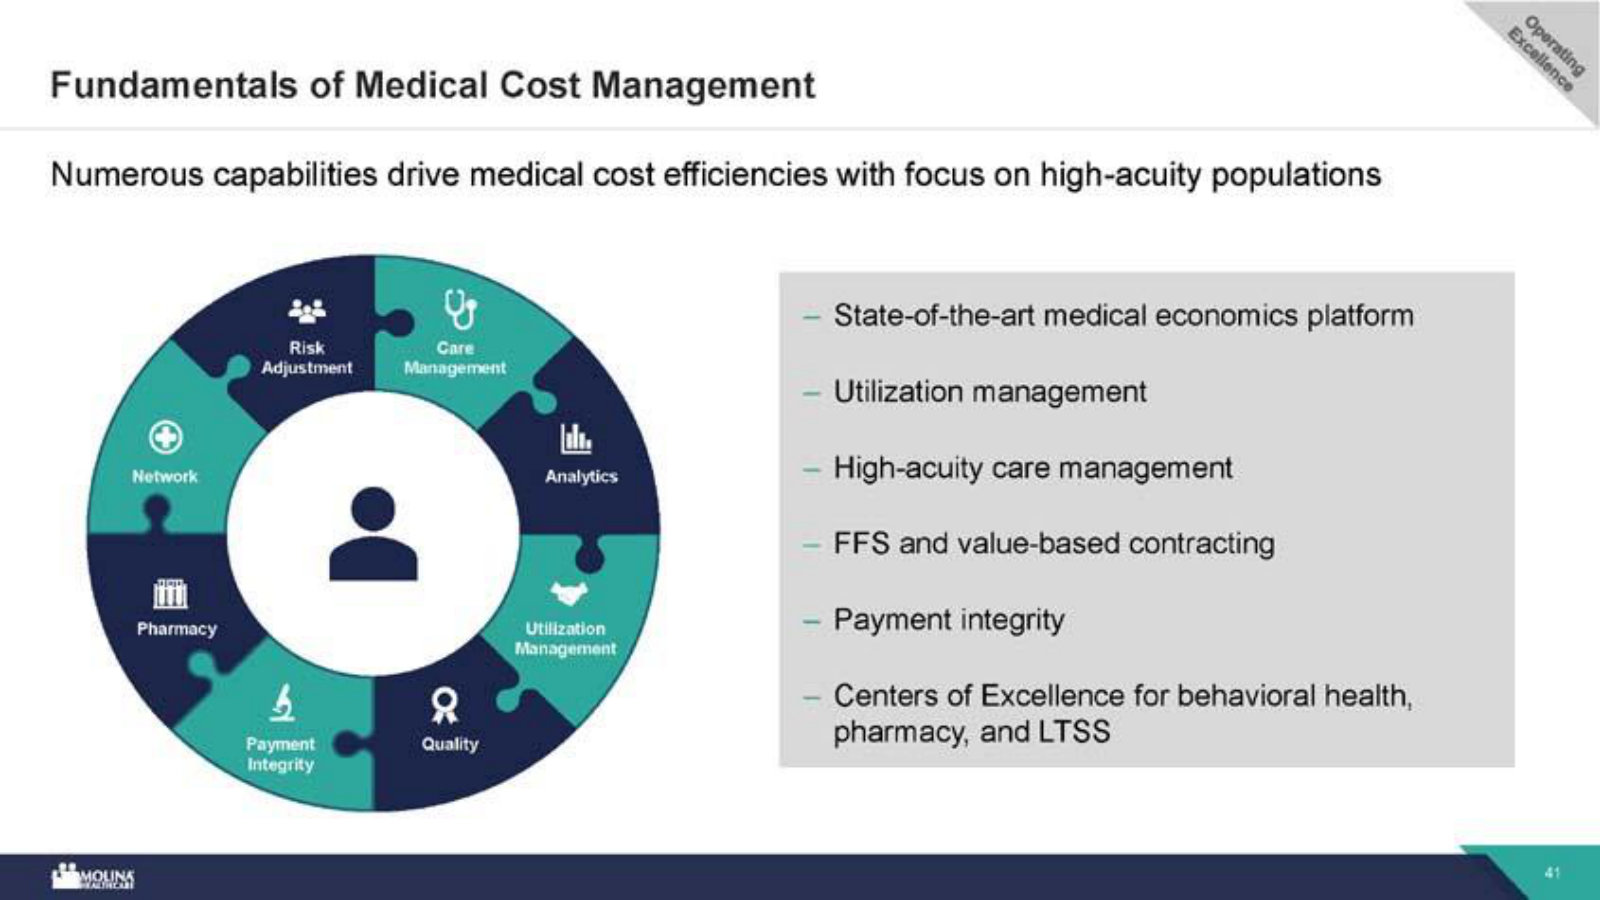
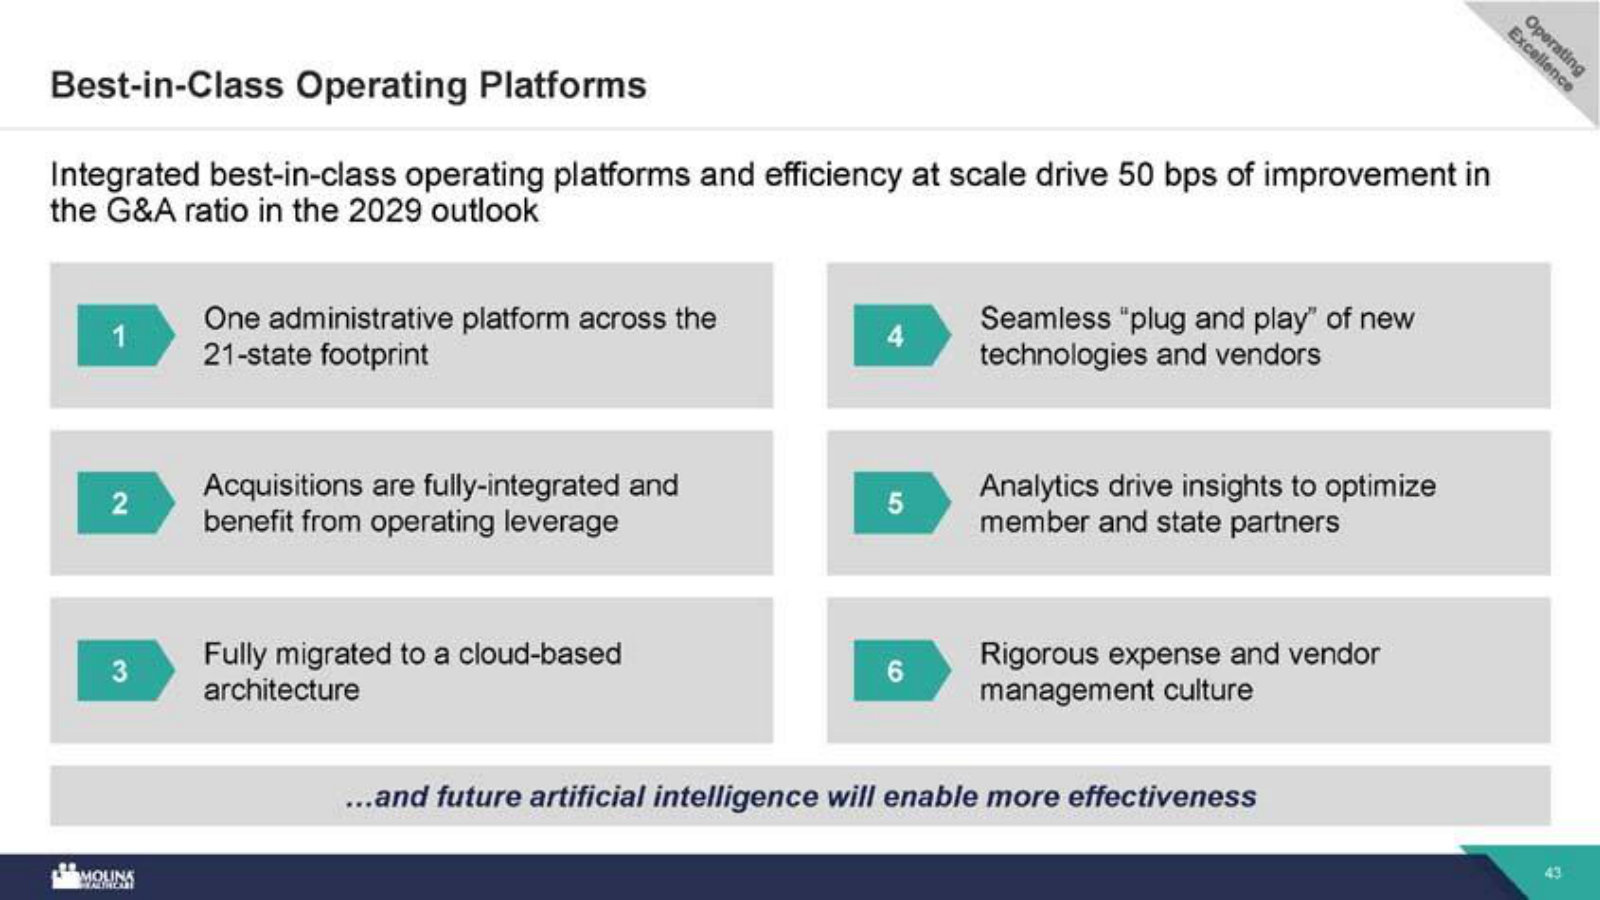
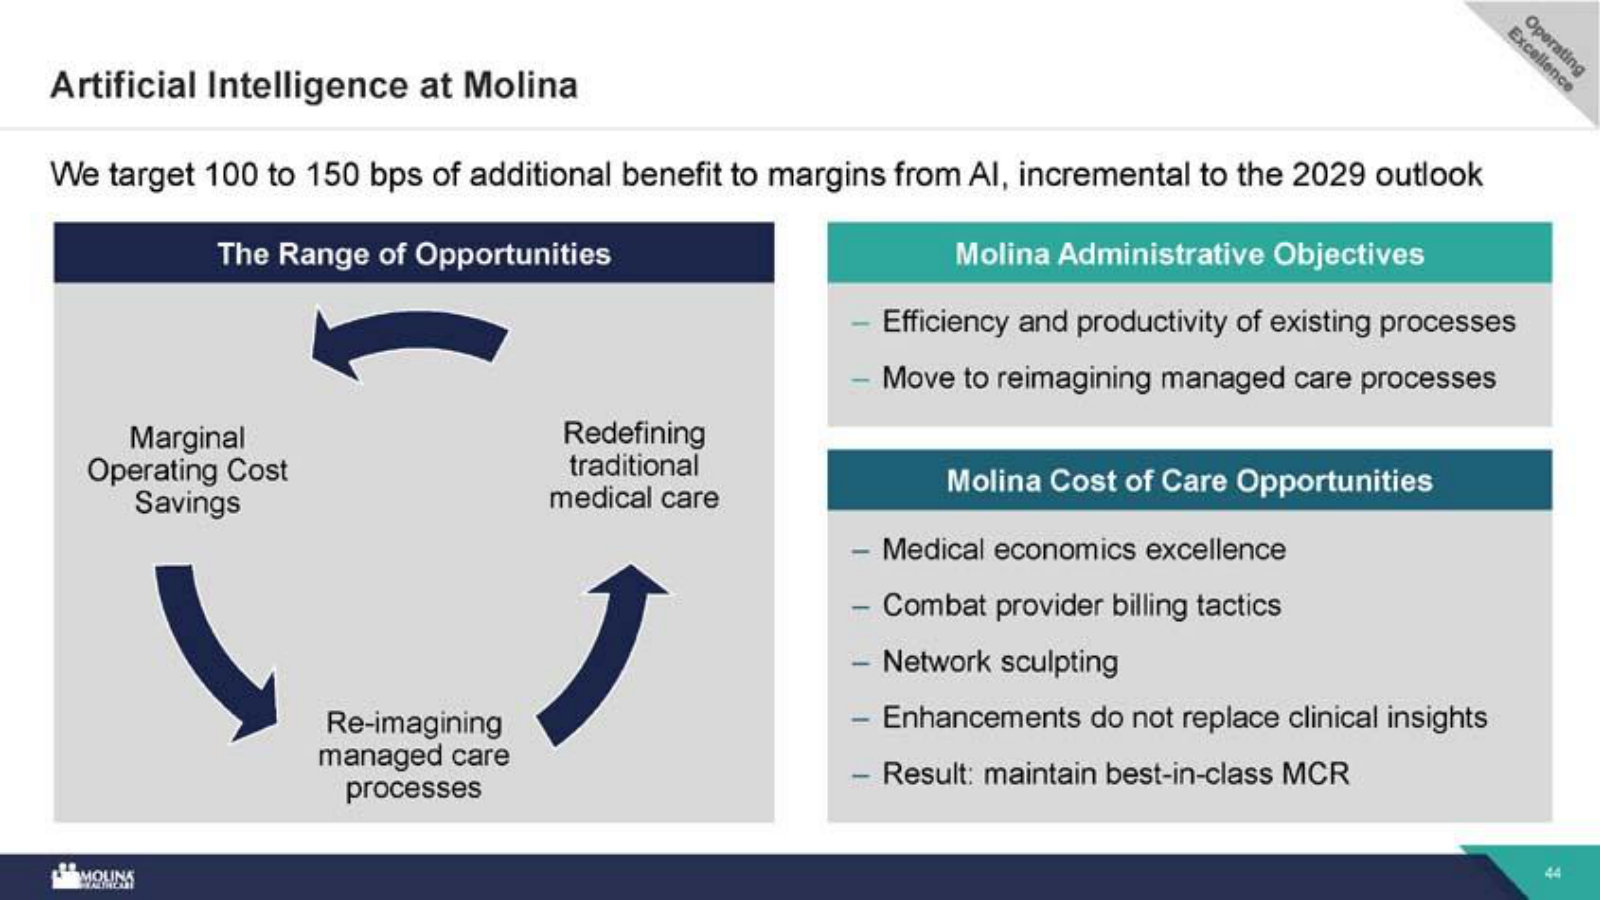
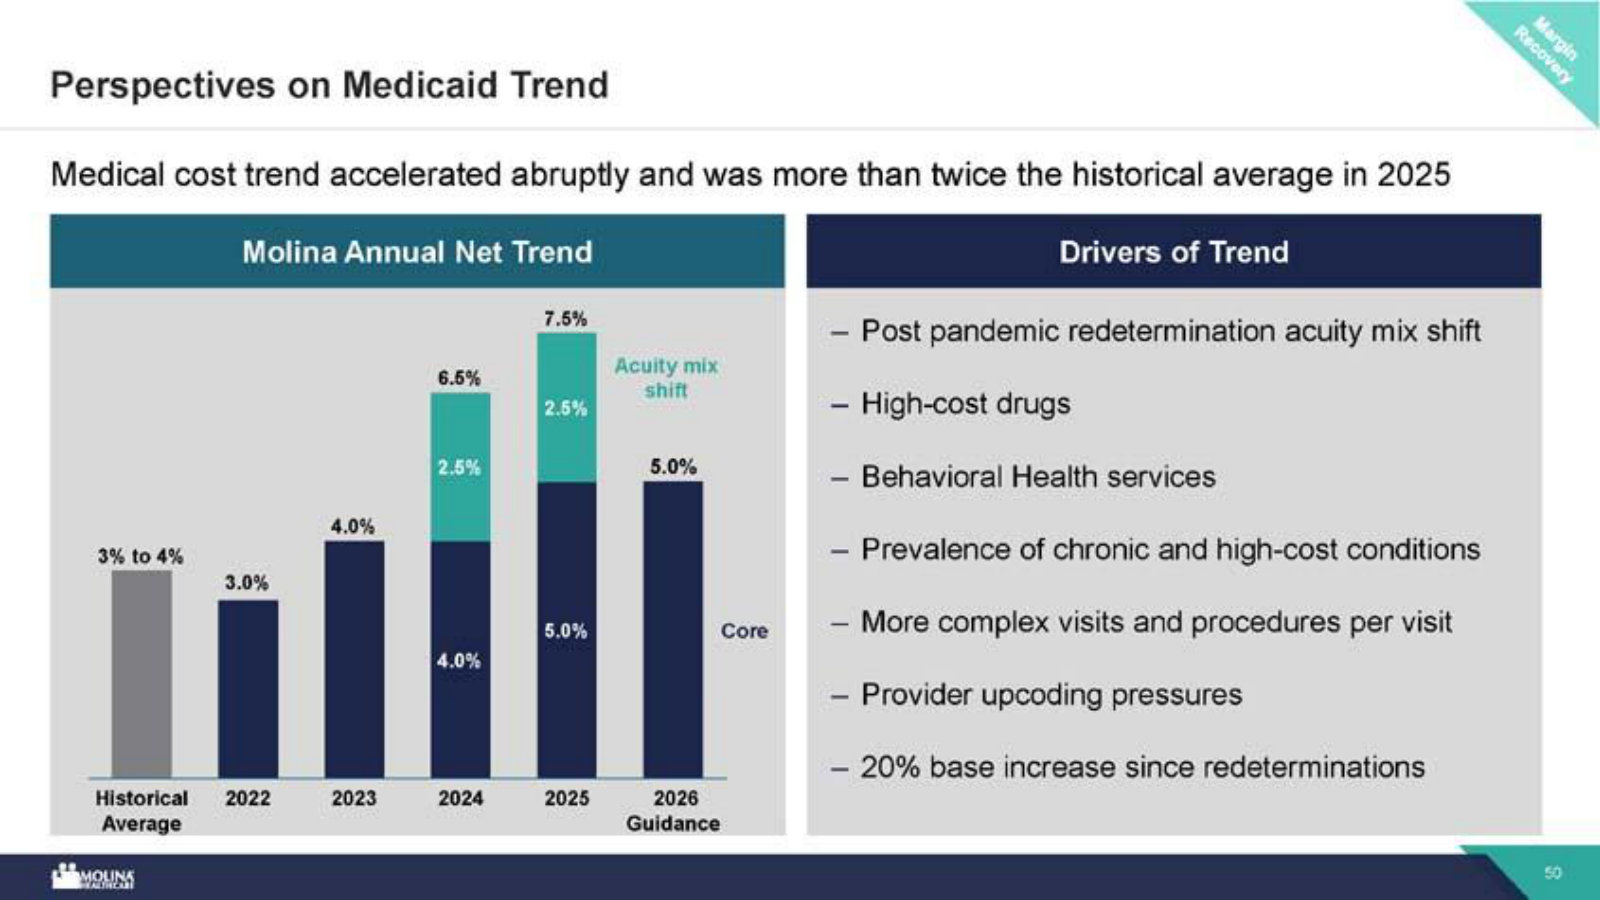
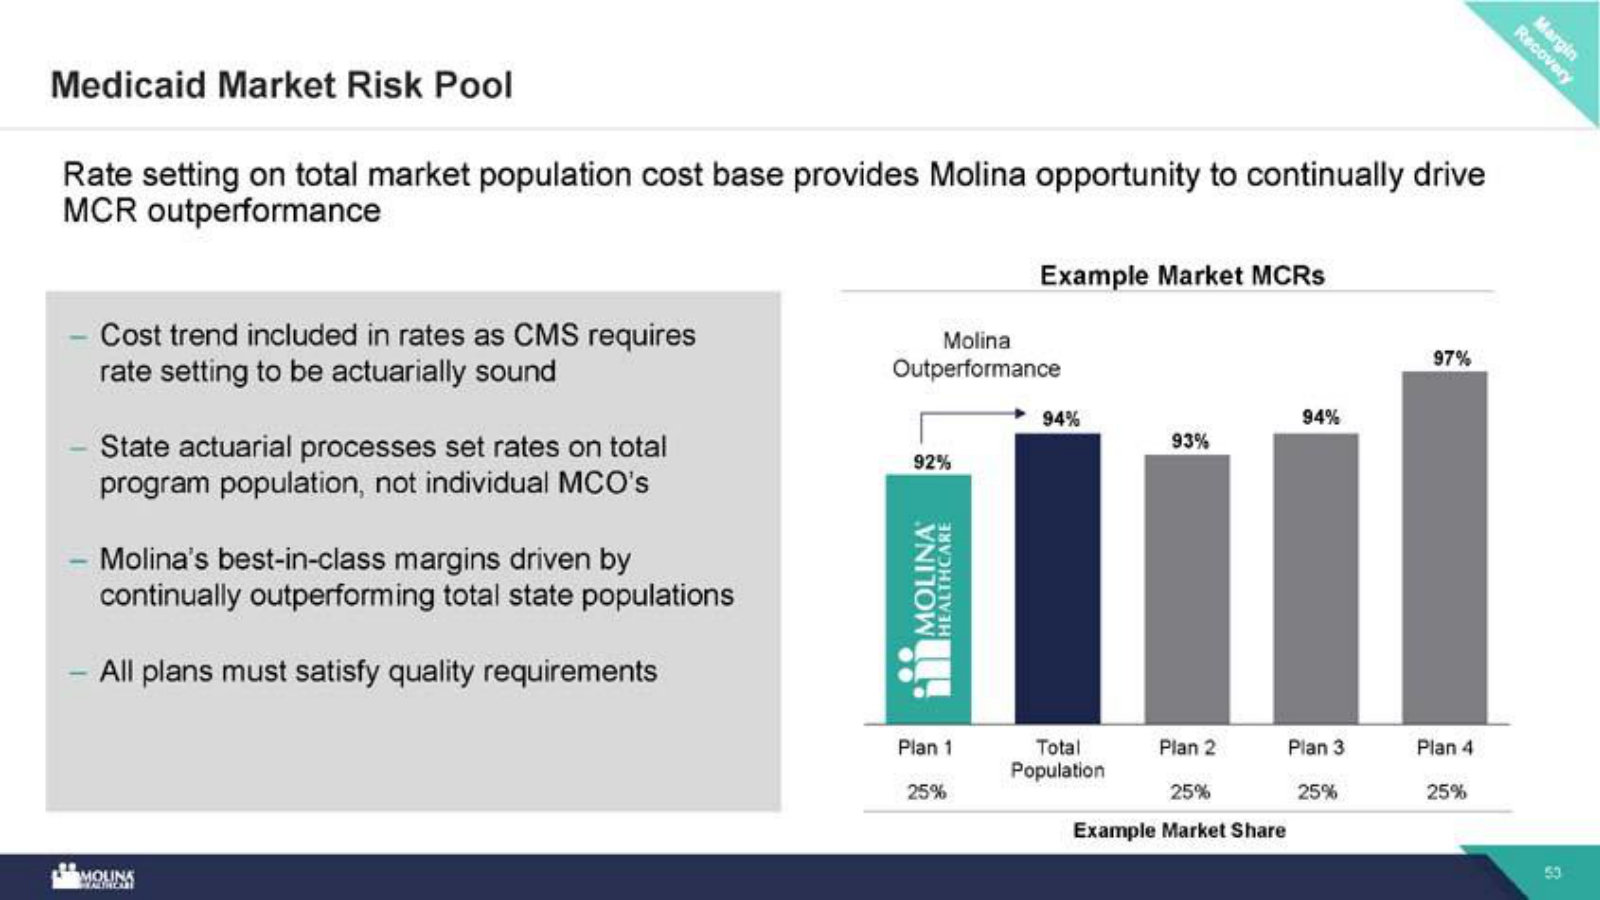
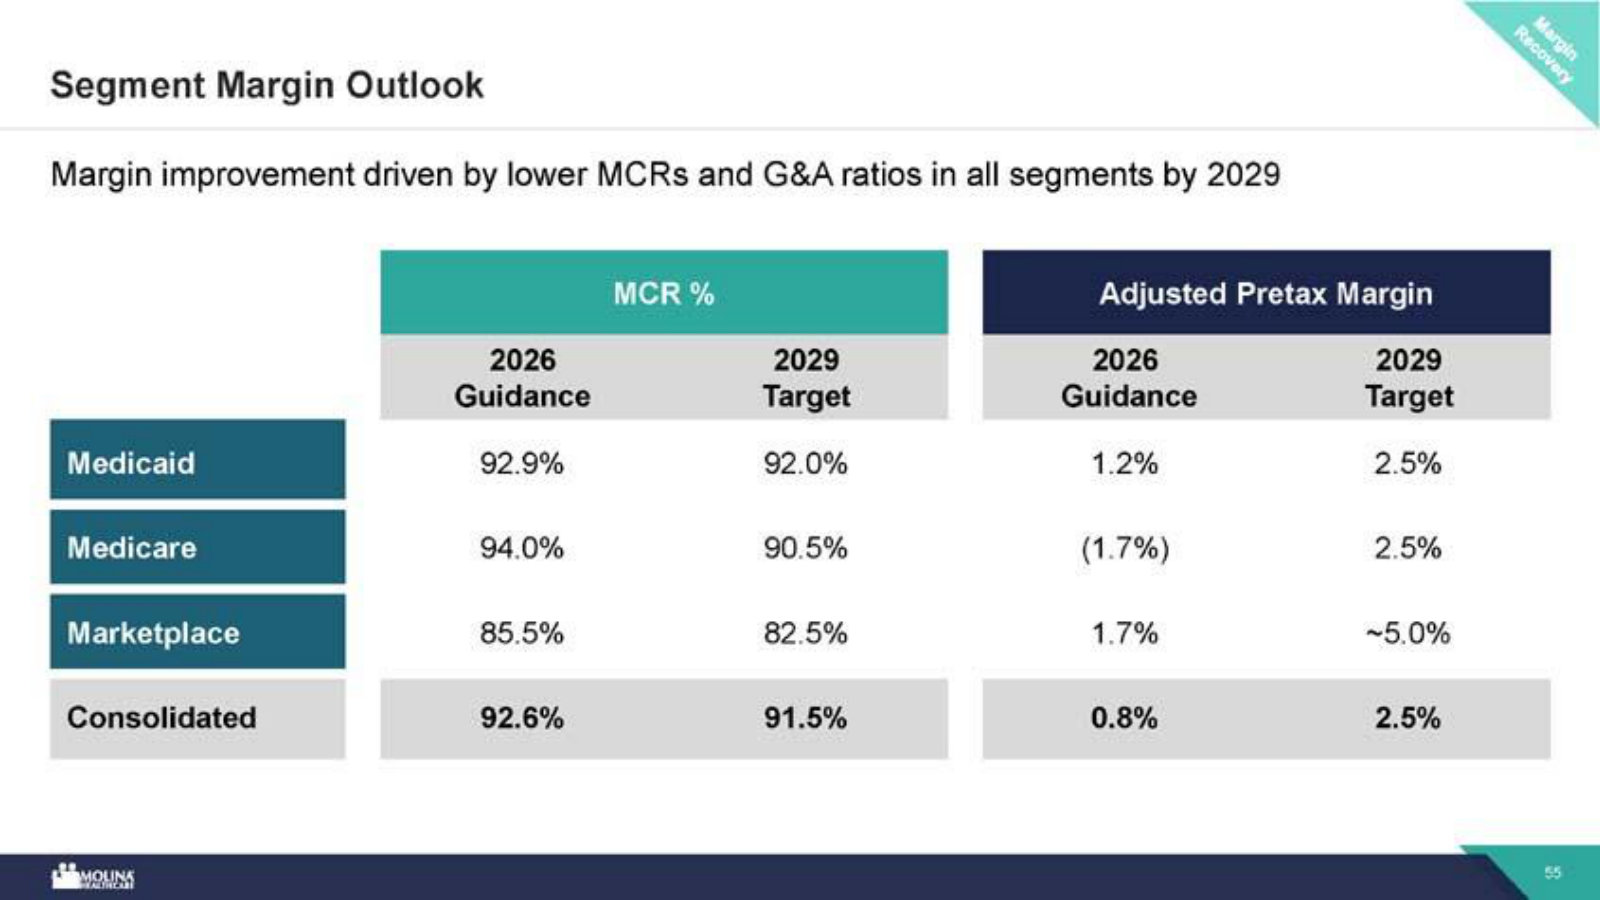
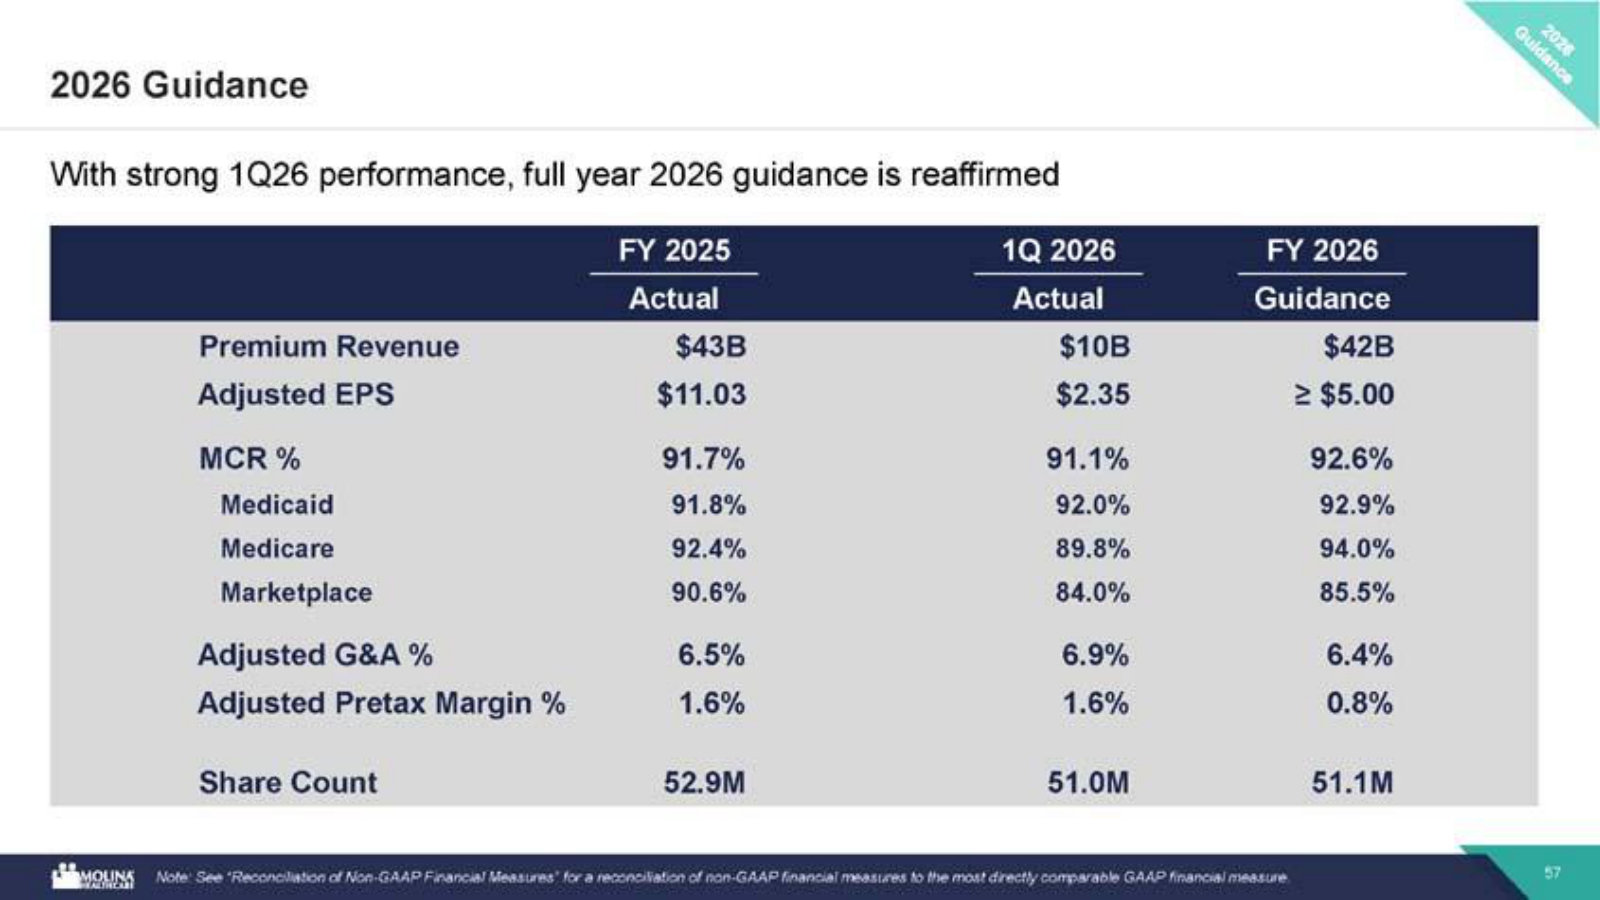
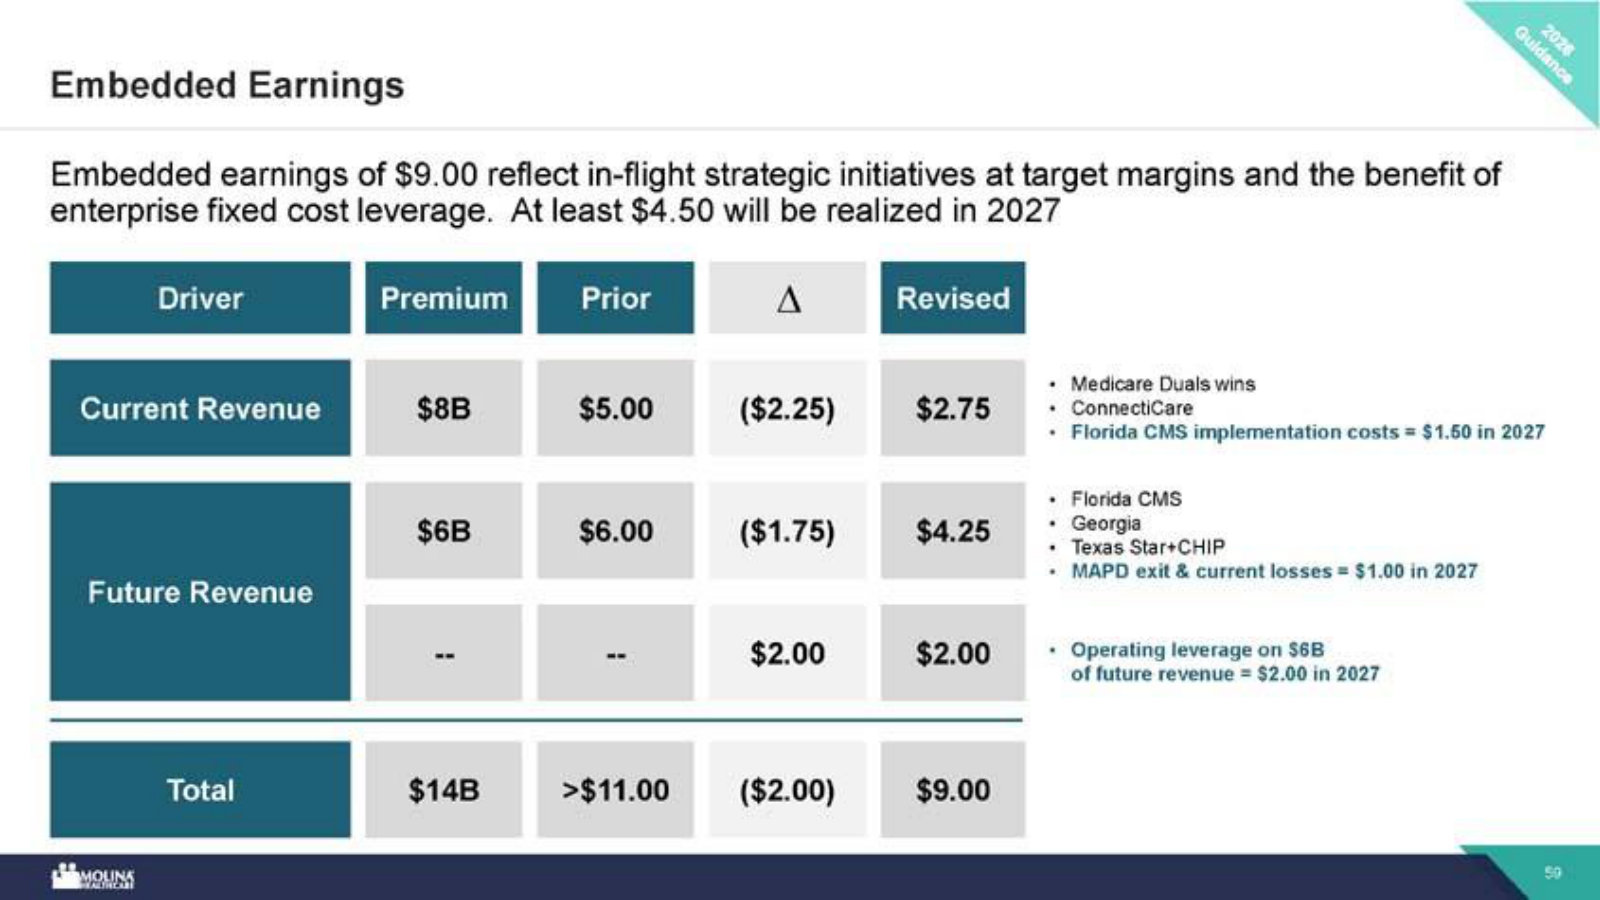
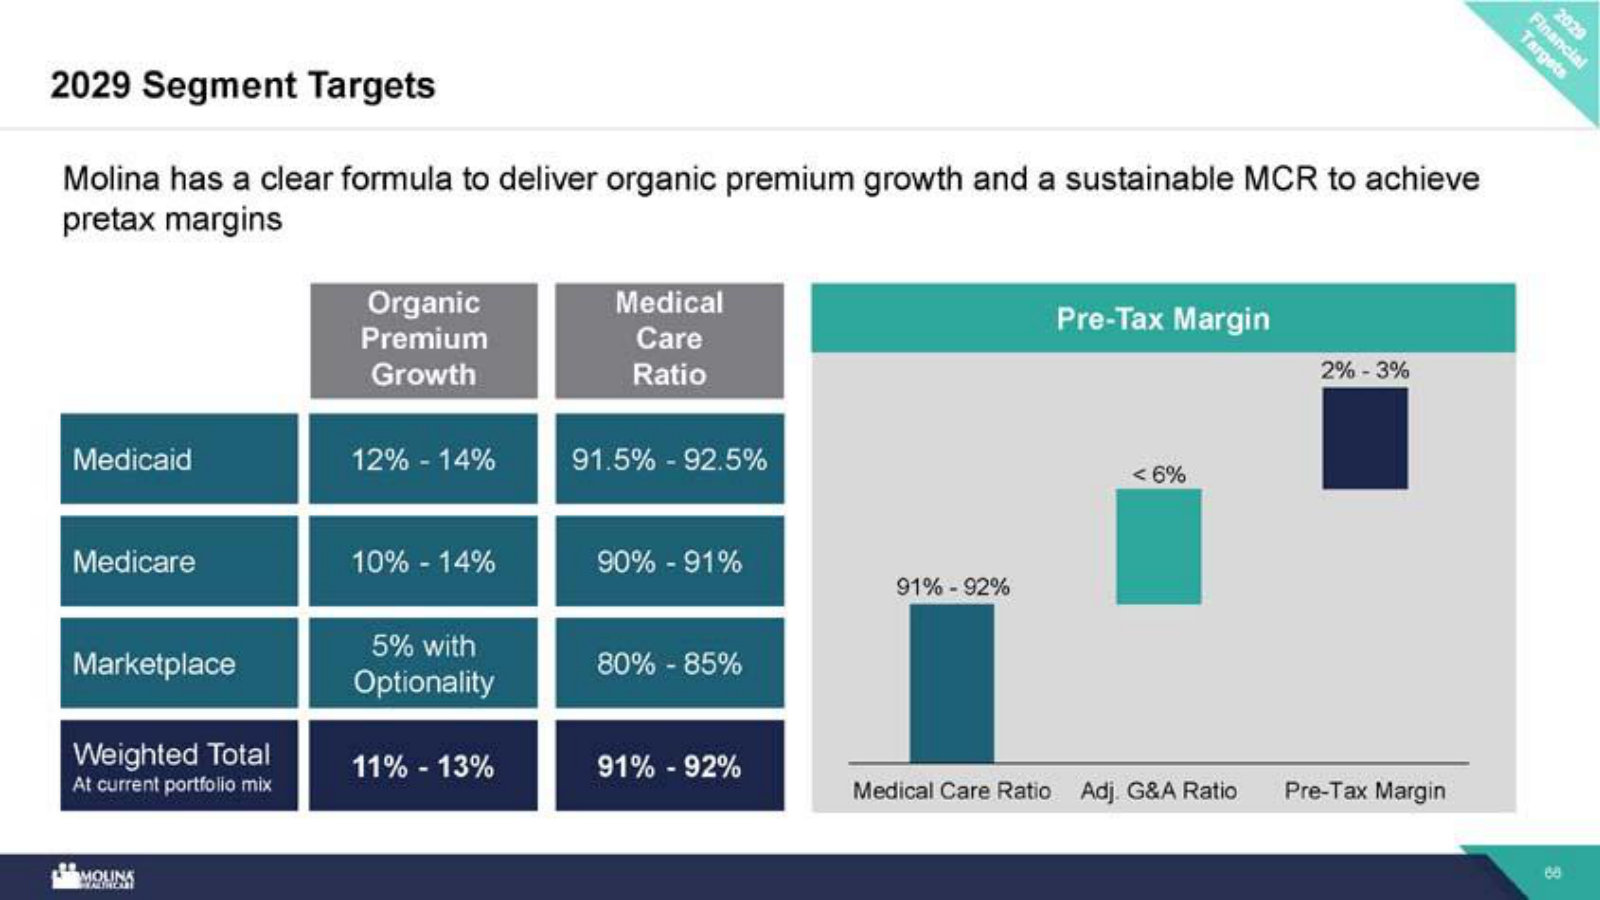
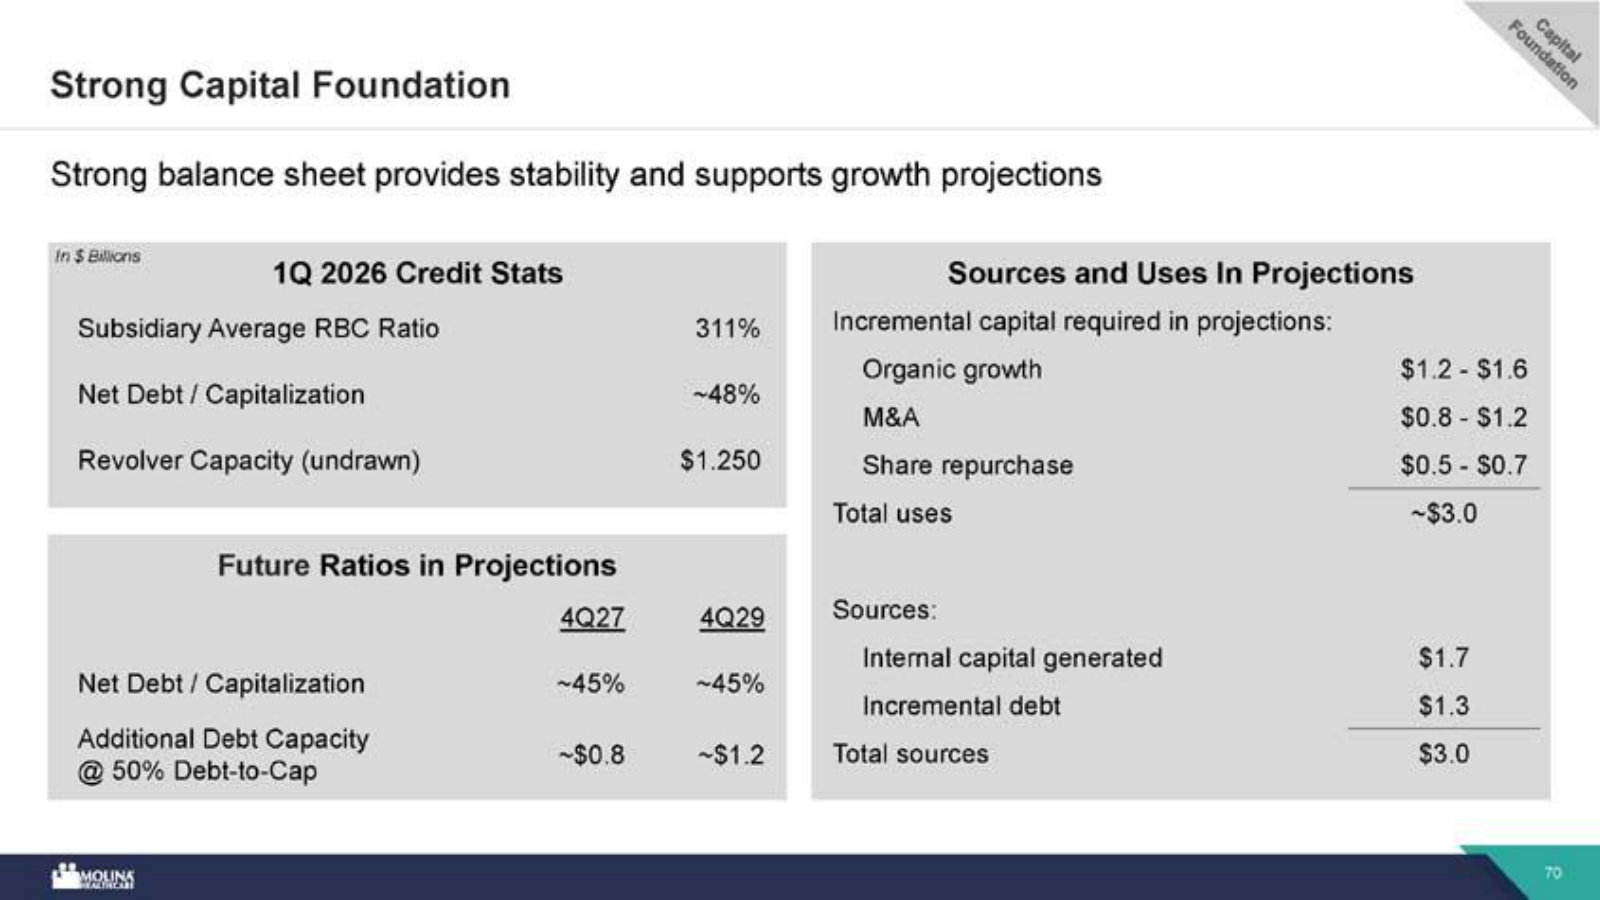
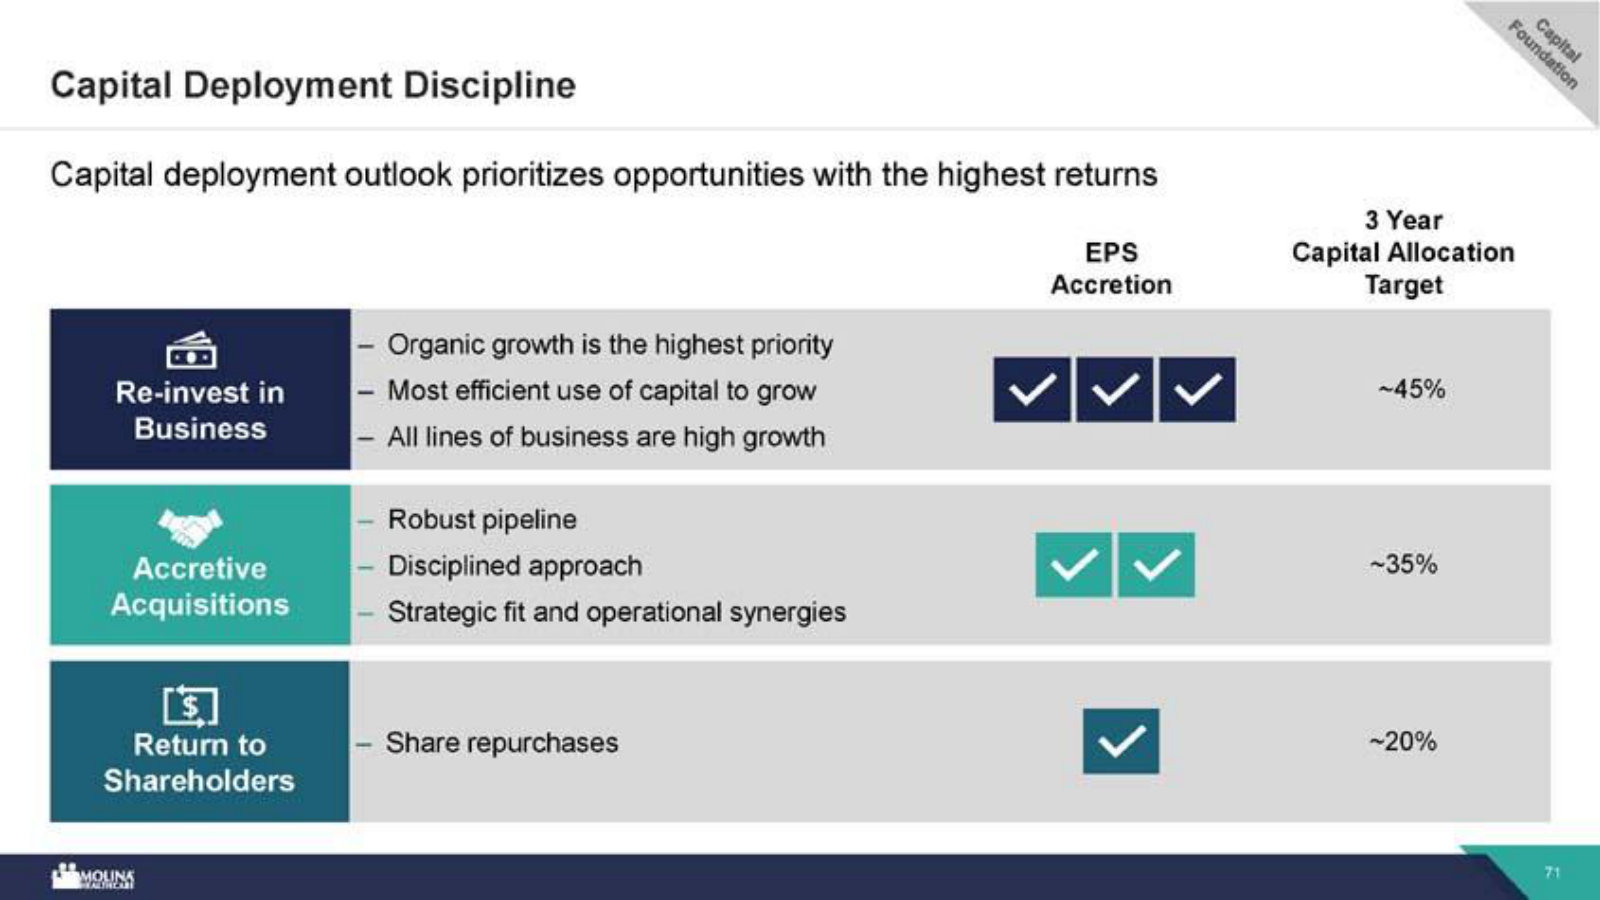
p. 8 — The 2029 targets in one table: $64B premium at a 15% CAGR and $25 adjusted EPS, on modest margin recovery from 2026. · Open the full presentation →p. 16 — The core claim: today's margin compression is cyclical and temporary — with the six pillars management rests the thesis on. · Open the full presentation →p. 18 — What Molina is, by the numbers: a Fortune 500 pure-play in government healthcare — $42B premium, 5.0M members, 21 states, three products. · Open the full presentation →p. 20 — Where the revenue comes from — a 21-state footprint map and the segment split: 79% Medicaid, 16% Medicare, 5% Marketplace. · Open the full presentation →p. 21 — How premium more than doubled since 2019 — a waterfall separating ~9% organic and ~6% M&A growth up to ~$42B. · Open the full presentation →p. 24 — The earnings story in one chart: 14% EPS CAGR to a $22.65 peak in 2024, then the 2025–26 drop as medical costs outran rates. · Open the full presentation →p. 26 — Why margins fell now — pretax margin by segment across 2021–24, 2025 and 2026G, showing the cost-trend inflection. · Open the full presentation →p. 27 — The structural edge, quantified: Managed Medicaid is underfunded ~300 bps, but Molina runs ~400 bps better than the industry. · Open the full presentation →p. 29 — The policy headwind — how the One Big Beautiful Bill and state actions are expected to trim Medicaid enrollment 2–3% a year through 2029. · Open the full presentation →p. 31 — The Medicaid growth bridge to a 12–14% CAGR: rate expectations, membership, embedded revenue and new RFP wins. · Open the full presentation →p. 32 — The new-state pipeline: $90B of contracts up for bid by 2029, and the win-rate math behind Molina's ~$6B target. · Open the full presentation →p. 33 — A worked example of the RFP engine — the $6B Florida children's-services win and the margins it is expected to earn. · Open the full presentation →p. 34 — The Medicare Duals growth bridge to a 10–14% CAGR, after exiting the standalone MAPD business. · Open the full presentation →p. 35 — Why Duals matters structurally: CMS's shift to Exclusively Aligned Enrollment favors insurers that hold both Medicaid and Medicare. · Open the full presentation →p. 37 — The smallest engine: Marketplace held to a ~5% CAGR, kept as optionality until the risk pool proves stable. · Open the full presentation →p. 38 — The fourth engine — a pipeline of ~250 potential targets bought near book value, and why the returns work. · Open the full presentation →p. 41 — The core competency: the capabilities Molina uses to manage medical costs for high-acuity, low-income members. · Open the full presentation →p. 43 — How scale becomes margin — one operating platform across 21 states, targeted for 50 bps of G&A improvement by 2029. · Open the full presentation →p. 44 — Where AI fits — 100–150 bps of potential margin benefit, on top of the 2029 plan, across admin and cost-of-care. · Open the full presentation →p. 50 — The heart of the 2025 miss: medical-cost trend spiked to 7.5%, more than twice its historical average, split into acuity and core. · Open the full presentation →p. 53 — Why Molina beats peers on MCR — rates are set on the whole market's cost base, rewarding the lowest-cost operator. · Open the full presentation →p. 55 — The margin-recovery map: MCR and adjusted pretax margin by segment, 2026 guidance versus 2029 target. · Open the full presentation →p. 57 — This year's numbers: FY2026 guidance against 2025 actual and 1Q26 — $42B premium and at least $5.00 adjusted EPS. · Open the full presentation →p. 59 — The bridge back to earnings power: $9.00 of embedded EPS from initiatives already in flight, with $4.50+ landing in 2027. · Open the full presentation →p. 66 — The formula behind the 2029 plan: organic growth, MCR and pretax margin targeted for each segment. · Open the full presentation →p. 70 — The balance sheet that funds it: RBC, leverage and the sources-and-uses behind ~$3B of projected capital. · Open the full presentation →p. 71 — How capital gets allocated — roughly 45% reinvestment, 35% M&A, 20% buybacks, ranked by return. · Open the full presentation →
The prior investor day, mined here for its evergreen market-structure slides: TAM, market share, portfolio synergies and the MCR edge over peers. · Open the full document →
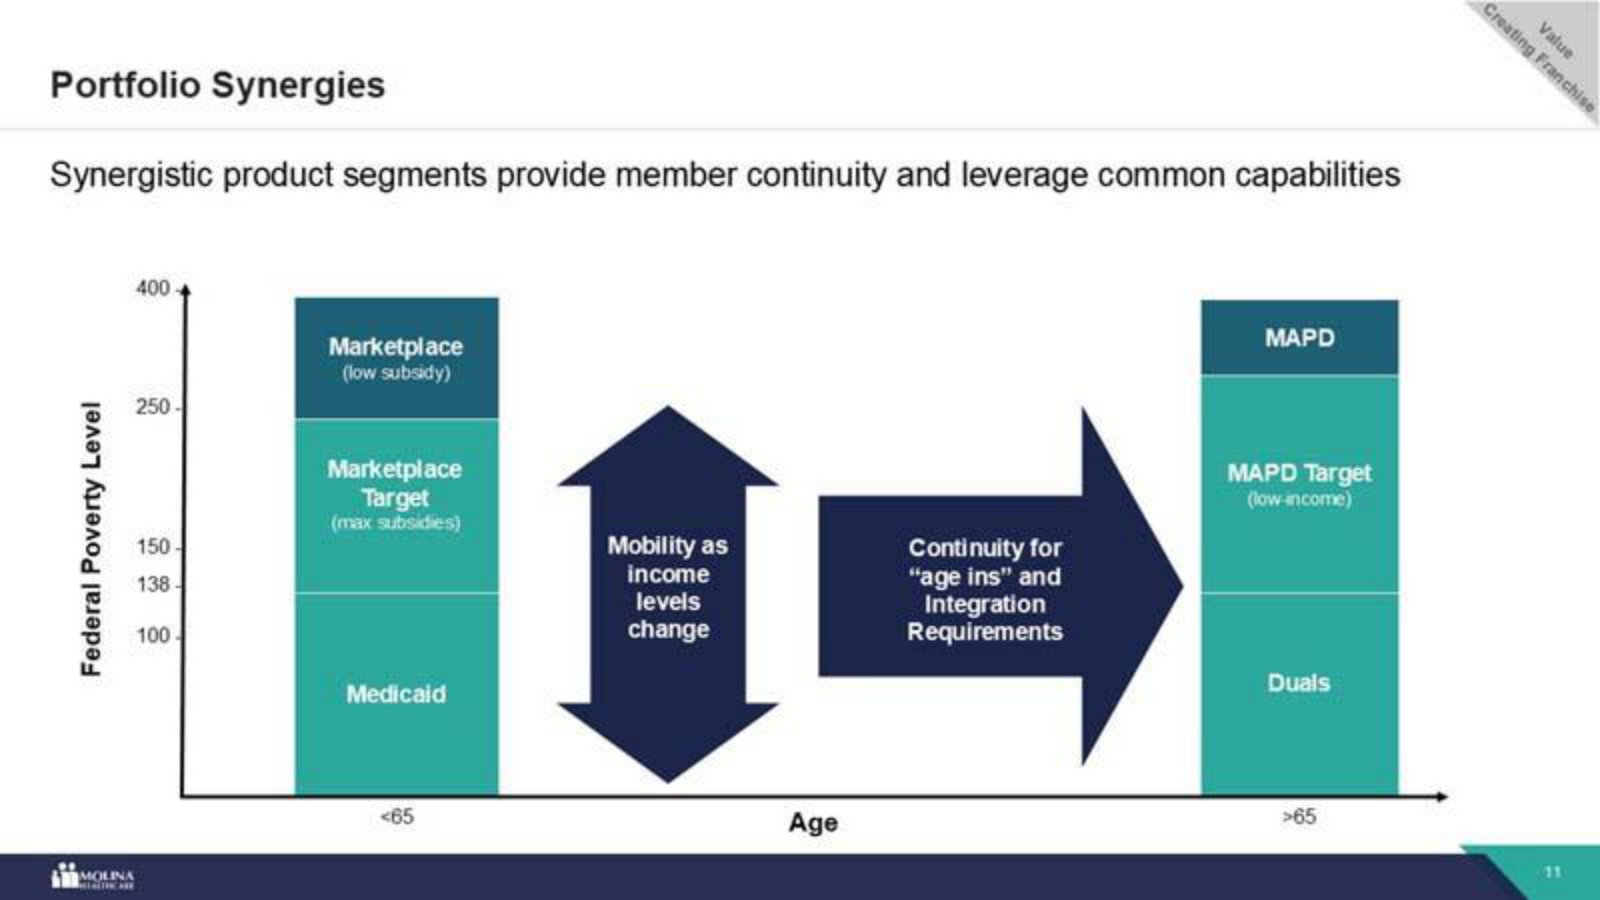
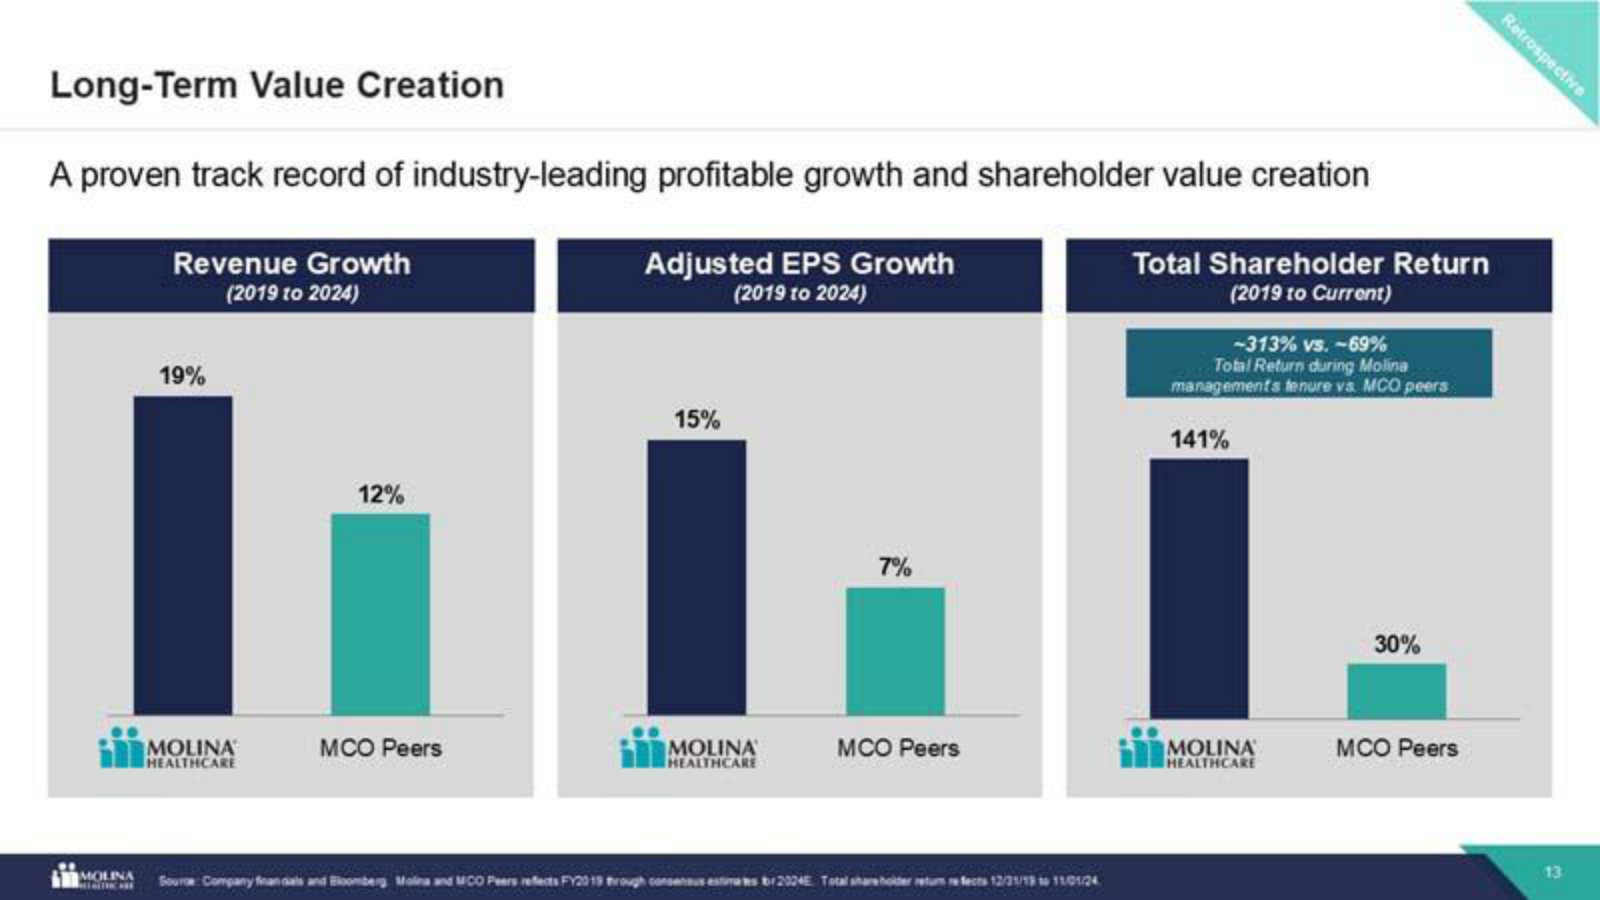
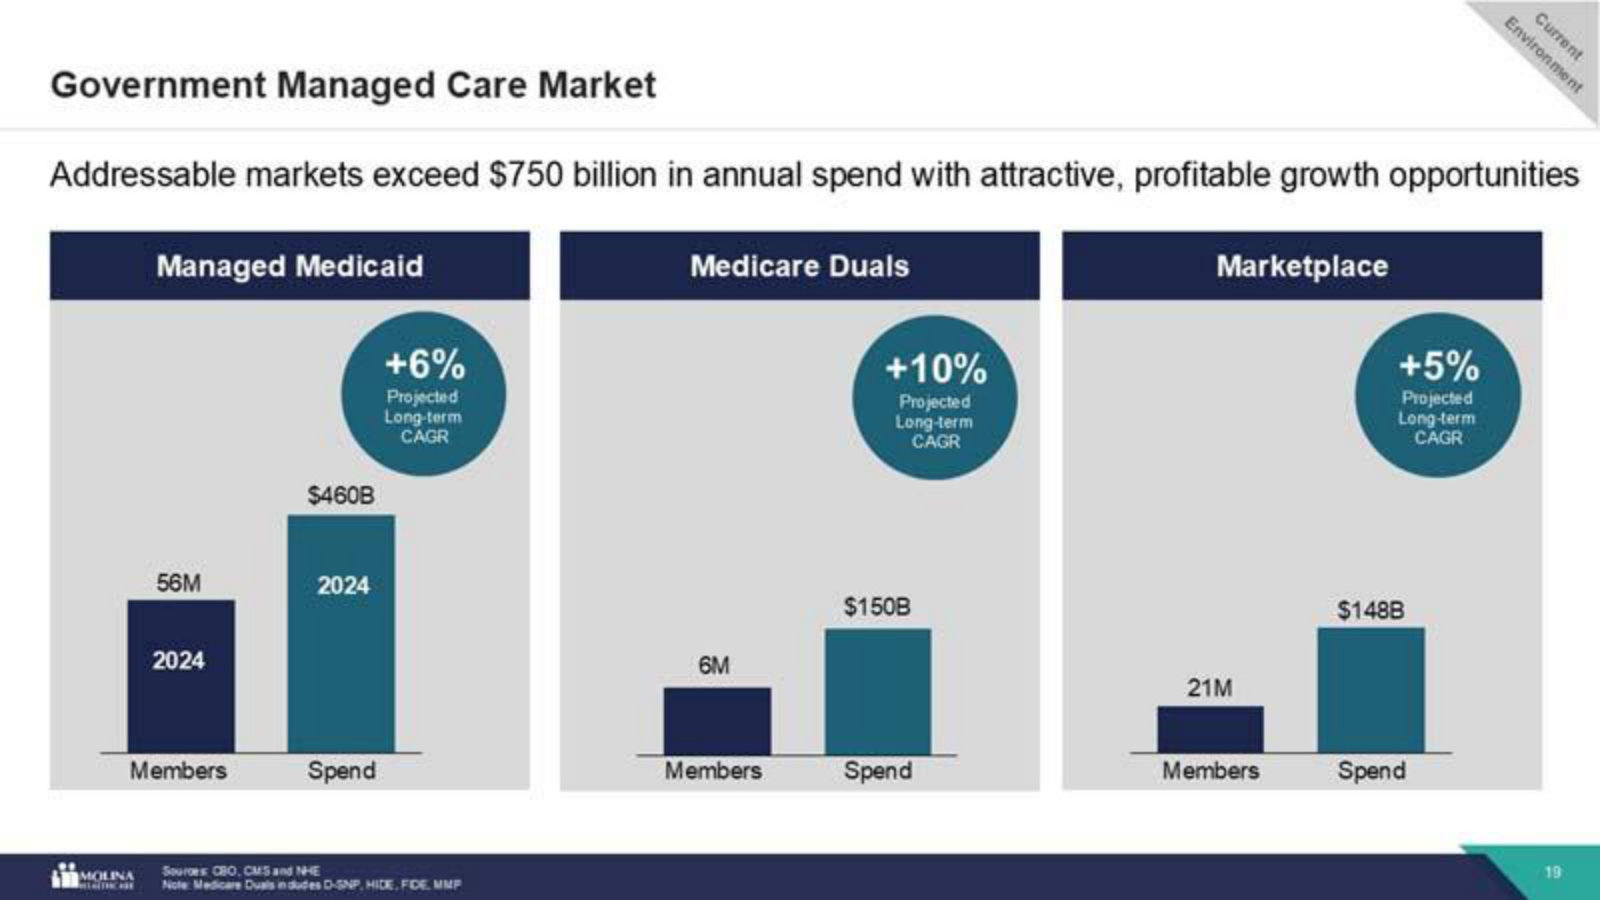
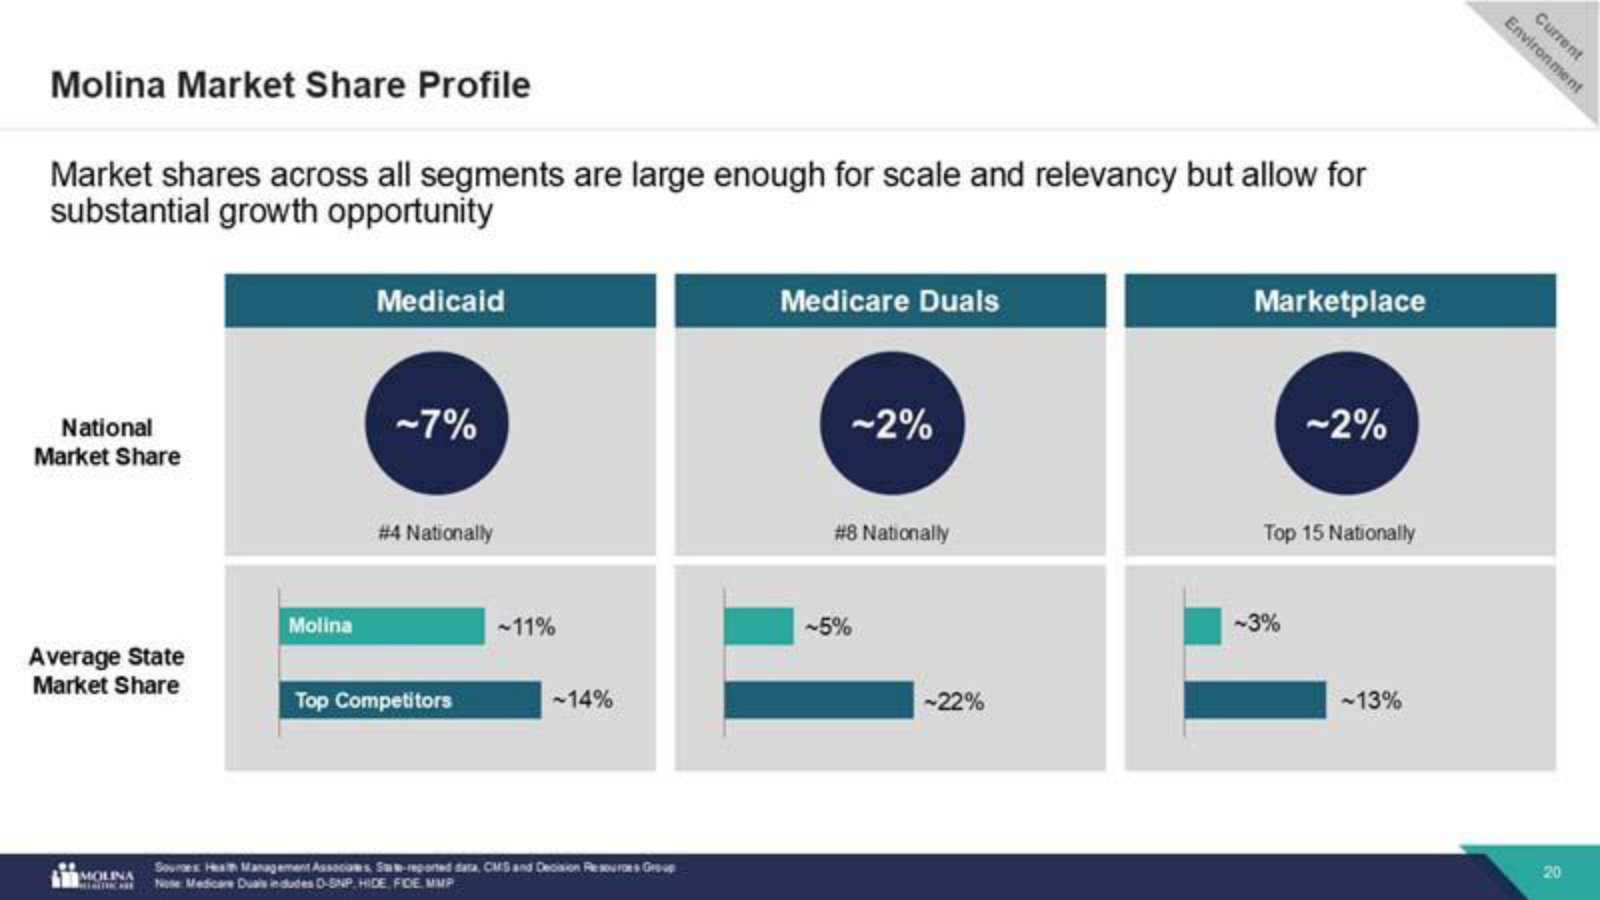
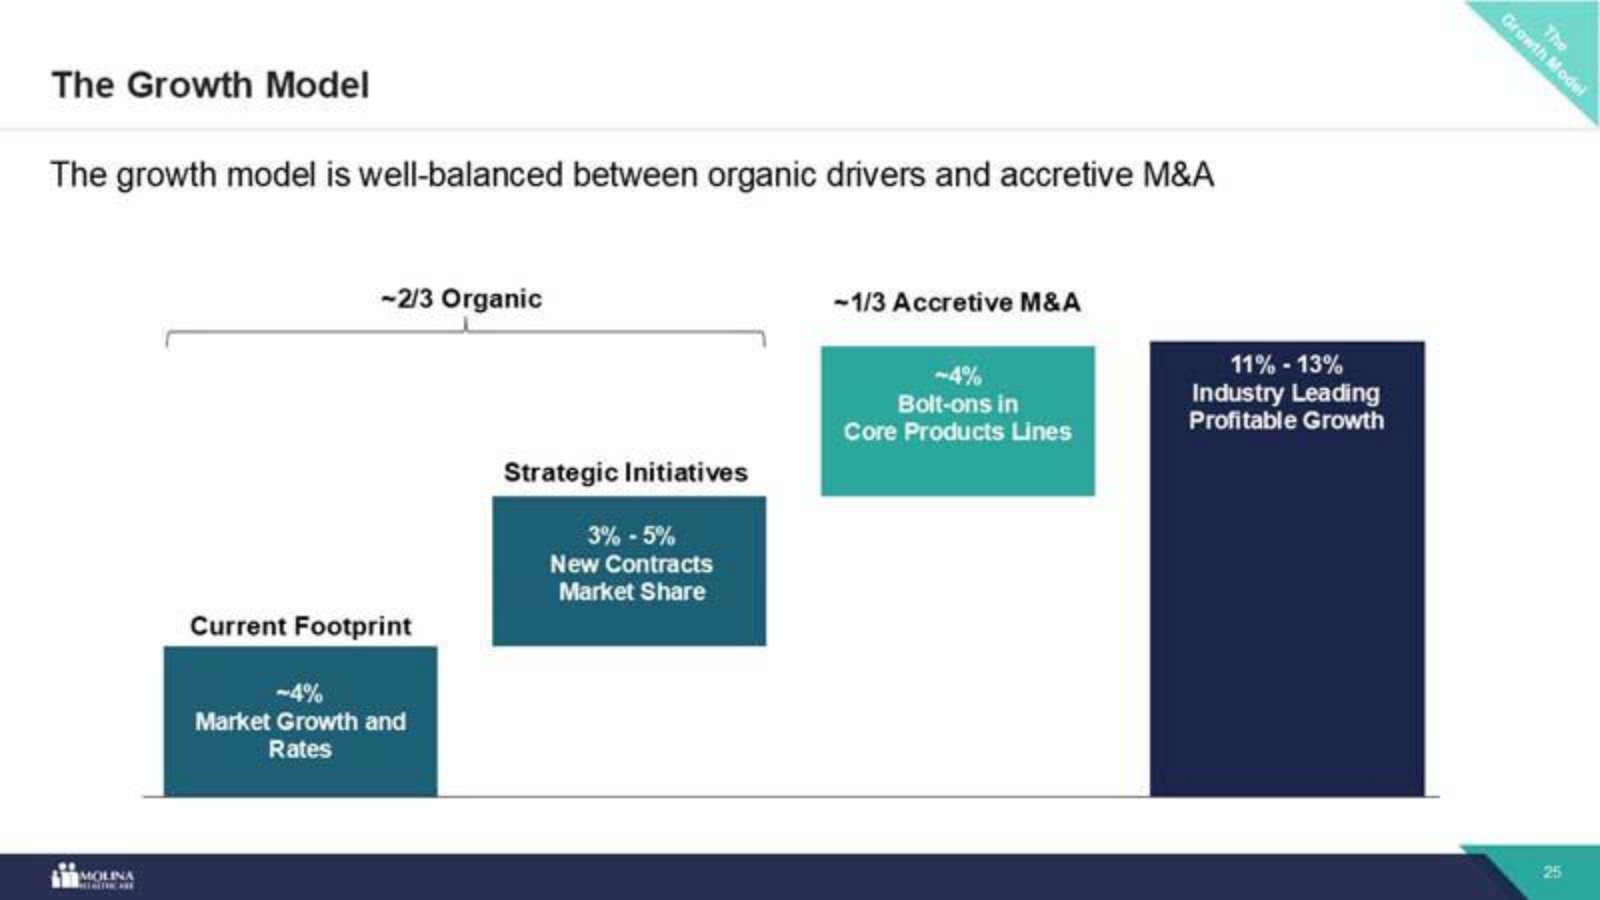
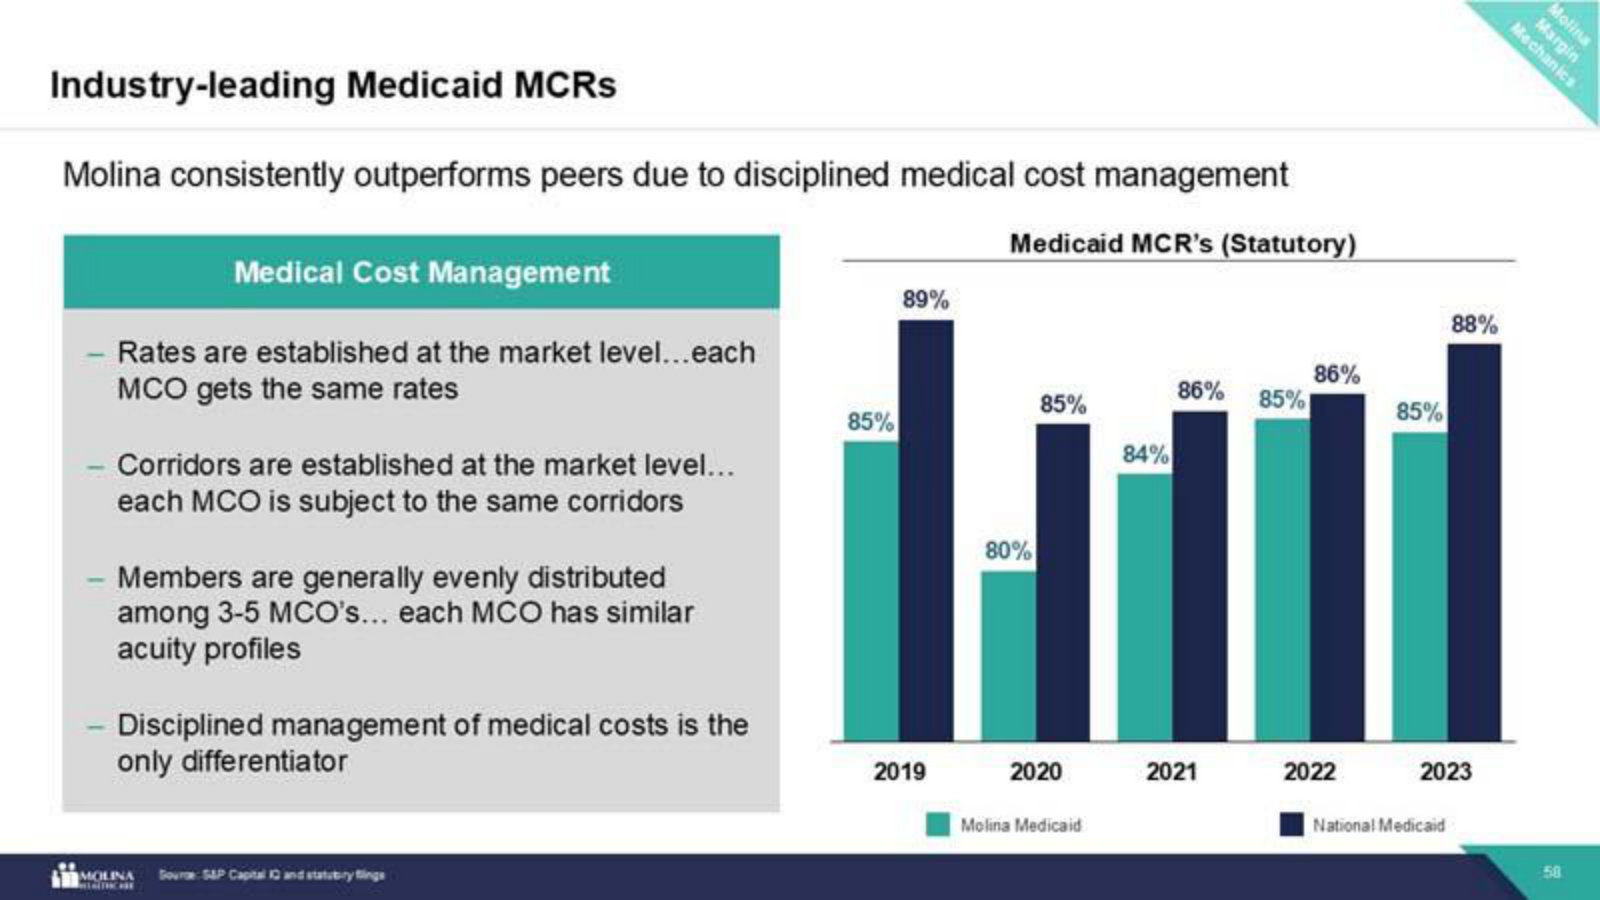
p. 11 — How the segments connect — members move between Medicaid, Marketplace and Medicare as income and age change, and Molina keeps them. · Open the full presentation →p. 13 — The track record versus peers: Molina's revenue, EPS and total shareholder return from 2019–24 against the MCO group. · Open the full presentation →p. 19 — The addressable market, sized: >$750B across Medicaid, Medicare Duals and Marketplace, with each segment's members and growth rate. · Open the full presentation →p. 20 — How much room is left — national and average-state share by segment (#4 in Medicaid), all still in single digits. · Open the full presentation →p. 25 — The growth model on one slide — roughly two-thirds organic, one-third accretive M&A, adding to 11–13% premium growth. · Open the full presentation →p. 58 — The cost-management edge over time: Molina's statutory Medicaid MCR consistently below the national average, 2019–2023. · Open the full presentation →
Investor Day 2023 — Sustaining Profitable Growth: The Next Wave — 2023 · 79 pages · The earlier investor day that set the $46B-by-2026 premium target and first laid out the four-engine growth model — the pre-downturn baseline. · Open →